
Equity Analyst- Maha Farooq
Feb 19, 2026
Investment Thesis
Green Brick Partners Inc (GRBK) represent a highly attractive long-term investment opportunity due to its vertically integrated business model, focused exposure to high growth Sunbelt market and premium land strategy. The company controls a substantial portion of its land pipeline, enabling it to capture land development margins, maintain superior profitability across housing cycles, as well as helps in mitigating cost volatility. The company’s “one-umbrella” operating structure allows centralized capital allocation and governance while preserving brand level flexibility resulting in consistent execution, disciplined growth as well as industry leading margins supported by a larger owned as well as controlled lot position of approximately 37,800 home sites. The company has strong visibility into future growth and the ability to scale efficiently as market conditions improve.
The company has demonstrated strong earnings growth, resilient returns on equity and invested capital as well as conservative leverage related to peers, positioning it well to navigate cyclical downturns. Despite these strengths the stock currently trades at $80 per share which implies a discount to intrinsic value. Using a conservative 12% discount rate and a DFCF based on normalized free cash flow growth based on the last 10 year, the company’s fair value estimates at $202 per share indicating meaningful upside as interest rate ease, housing affordability improves and capital returns continue to support EPS growth and multiple expansion.
Business overview
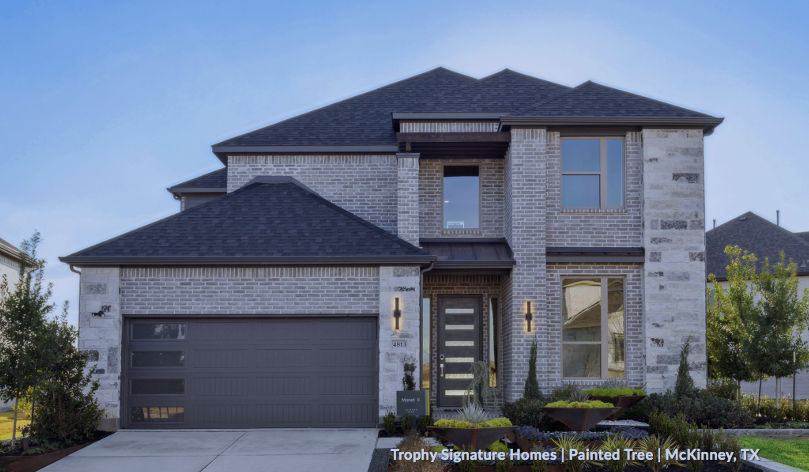
Green Brick Partners Inc. is a diversified homebuilding and land development company in U.S with strong presence in high-growth Sunbelt markets, including Austin, Dallas-For Worth, Atlanta, Houston as well as Florida’s Treasure Coast. Through a portfolio of seven differentiated builder brands the company operates across a broad range of housing segments, from entry level and townhomes to luxury single family residences.
The company is vertically integrated across the residential value chain, encompassing land acquisition and development, design, title, construction, entitlement, mortgage, insurance and marketing & sales.
The company is relatively unique among mid-sized homebuilders. The integrated platform enables tighter cost control, standards and faster responsiveness to local market condition as well as consistent quality. Green Brick’s strategy emphasizes premium location, distinctive designs as well as high quality construction while maintaining conservative leverage and disciplined capital allocation to support long-term value creation and downside risk mitigation.
Business Model
Green Brick Partners focuses on acquiring, developing as well as monetizing land through the construction and sale of single-family home in high growth U.S markets primarily Texas, Georgia and Florida. The company control significant portion of its lot supply by purchasing as well as self-developing land allowing the company to capture land development margins, protect profitability and manage cost across housing cycle. The company operates through a portfolio of subsidiary homebuilding companies that function under a single umbrella.
These builders include Trophy Signature Homes, CB JENI Homes, Normandy Homes, Southgate Homes, Centre Living, The Providence Group, as well as GRBK GHO Homes all brands are established to serve specific geographic markets and product segments and are fully developed and owned by Green Brick Partners. While each brand maintains its own local identification, customer focus, pricing strategy all of the brands operate within the company’s centralized framework for land acquiring, development, governance and capital allocation. It helps in operational efficiency, consistent execution across market and margin discipline.
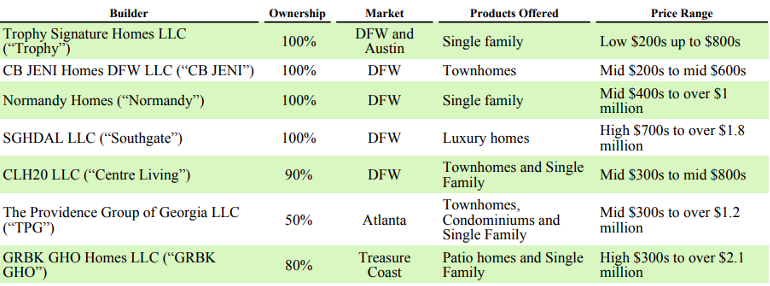
Source: Company’s 10K report
Segment overview
The company operate two main core segments
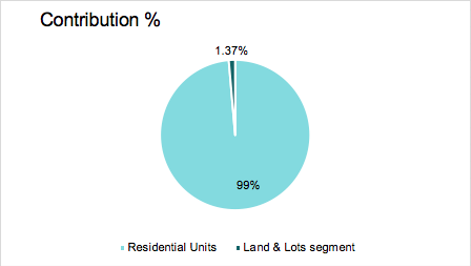
Residential Units: This segment represents the primary source of earnings, it includes revenue from construction as well as sales of homes across its diversified builder portfolio and accounted for the vast majority of total revenue. The company delivered approximately 3,783 homes as of 2024 generating a total revenue of $2.1 billion from this segment alone. Indicating strong demand across its Sunbelt markets. Revenue increased to $2.11 billion as of 2025 (TTM) supported by stable delivery volumes and continued operational efficiency. 2,905 homes were delivered during the first nine months of 2025.
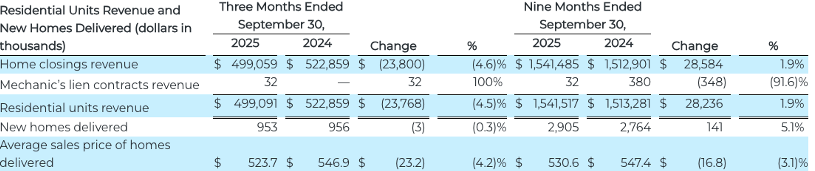
Source: Company 3rd quarter report 2025
For the nine-month ended September 30, 2025 the company reported revenue of $1.54 billion slightly higher compared to $1.51 billion in first nine months of ended September 30, 2024 indicating an increase YoY. This modest growth was driven by higher home deliveries despite a decline in average selling prices. The decline in average sales price in 2025 was mainly due to increased use of buyer incentives as well as discounts and a shift toward quicker move in homes in response to high interest rates and affordability pressure. However, at the same time the company delivered fewer homes compared to last year due to its backlog of sold home declined significantly and management slowed construction starts to better align supply with less market demand.
Source: Moods Investment research
Land & Lots segment: This segment consists sale of finished lots or land parcels to third parties it remains a smaller as well as more opportunistic component of the business as the company primarily retains as well as supports its own homebuilding operations. Revenue generated from this segment as of 2024 was $28.8 million. As of third quarter of 2025 backlog stood at 675 homes with a value of approximately $465.6 million suggesting continued revenue visibility despite a normalization in order activity.
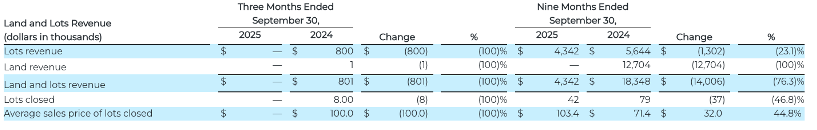
Source: Company 3rd quarter report 2025
This segments revenue in Q3 2025 was $4.3 million. It decreased by 23.1% compared to Q3 2024 of $5.6 million. Indicating substantial reduction in lots closings. The cost of sales decreased in line with lower activity. The decline is mainly due to the company’s strategic decision to sell less land parcels and retain land for its own homebuilding operations along with lower transaction activity and cautious demand from other builders.
The slowdown in the real estate industry primary caused by high mortgage interest rates, reducing the housing affordability and buyer uncertainty which lead to weakened demands.
Financial Analysis (2016-2025 TTM)
Revenue expanded modestly over the last decades between 2016-2025(TTM) rising from $380 million in 2016 to $2.1 billion in 2025 representing more than a doubling in topline scale within four years. The growth accelerated meaningfully post 2021 reflecting expansion in operations as well as higher transaction volumes and improved pricing.
Trend based on the last 5 years

Source: Moods Investments Research
Net income followed a similar upward trajectory it increased from $24 million in 2016 to $339 million in 2025 (TTM) profitability increased alongside revenue growth indicating operating leverage as well as scale benefits partially offset rising cost and interest expense.
However, the company’s free cash flow has been volatile over the last 10 year (2016-2025) after a negative free cash flow in 2016 of -7.5 million to $158 million in 2025(TTM) driven largely by heavy investments as well as working capital demand, the company managed its volatile FCF primary through strong operating cash flow generation in recent years as well as with a flexible land-light investment strategy and disciplined working capital management. The company didn’t rely heavily on debt however, debt was used to support land development as well as for construction. The FCF has been volatile due to timing of construction spending versus home sales receipt.
Between 2021-2022 the company heavily invested in expanding its core communities across Texas as well as Georgia, particularly in North Texas master planned developments such as Lakeview Downs, Legacy Hills and South Pointe as well as several projects in Atlanta metro area. Such investments required significant upfront cash for land acquisition, infrastructure as well as homes under developments. Since many of these communities were still in early development stages cash inflows from home closings lagged the initial investment resulting in negative FCF despite strong earnings growth.
Capital Expenditure & Debt Analysis
The company capex remained consistently elevated. Between 2016-2025(TTM) it ranged between $0.3- $8 million. It rose from $0.3 million in 2016 to $4 million in 2025(TTM), however it peaked at $7.8 million in 2023 primarily due to timing and expansion related investments that year the company accelerated community openings and development activity which required a higher spending on model homes, IT system, infrastructure and corporate facilities to support its larger operating scale. Importantly this spike was one-off as well as non-recurring as evidenced by CapEx normalized, suggesting a business model that is less capex intensive at the corporate level but heavily reliant on working capital as well as land investment rather than fixed assets.
Trend based on the last 5 years
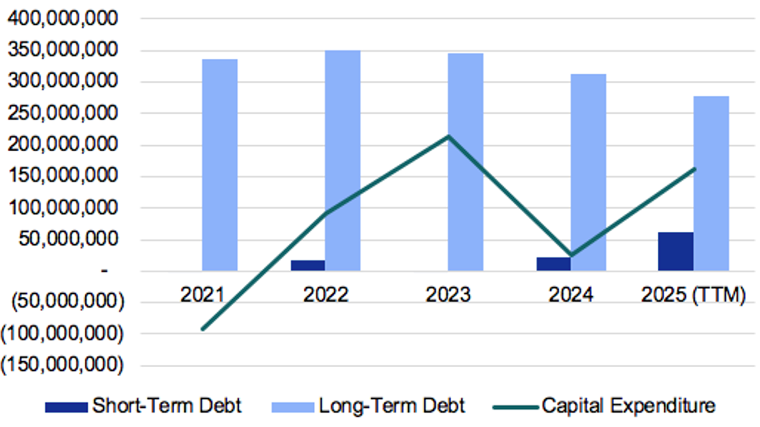
Source: Moods Investments Research
The company’s total debt slightly increased from $339 million in 2021 to approximately $340 million in 2025(TTM) after peaking higher in interim years. The elevated leverage reflects the financing needs associated with growth as well as inventory build-up. However, debt levels have stabilized recently. They remain a key risk particularly in a higher interest rate environment.
Green Brick Partners short-term debt has been irregular over the period earlier years short term borrowing was minimal indicating limited reliance on revolving or near-term financing. Mid cycle short-term debt spiked sharply due to accelerated land acquisition as well as construction activity indicating tactical use of short-term funding to bridge working capital needs, in recent years short-term debt declines again and even turns slightly negative in some periods. Implying repayment, refinancing into long-term facilities or access cash offsetting short-term obligations.
The company’s long-term debt rose steadily as it scales its homebuilding operations indicating increased land development, community expansion but this has been completed by strong growth in retained earnings which represent internal generated equity from accumulated profits. Although retained earnings declined in 2025 likely due to capital allocation decisions such as share repurchases and increased investment rather than financial weakness. However, the company’s cash flow position has improved significantly with free cash flow turning strongly positive in 2025(TTM) indicating stronger internal liquidity.
Competitive Analysis
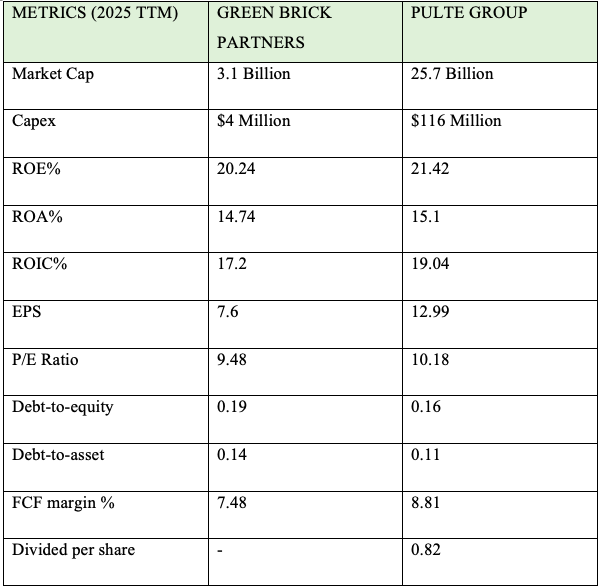
Pulte Group is a larger as well as somewhat more profitable. However, Green Brick Partners appears slightly cheaper and marginally more conservative financially. Green brick have a market cap of $3.1 billion compared to $25.7 billion of Pulte Groups suggesting Pulte Group operates on a much larger scale which support stronger growth and operational capacity. Both companies indicate strong profits. However, Pulte profitability ratios are modestly higher. Though Green Brick’s trade at slightly lower P/E multiple which could indicate the market applies a small valuation discount to Pulte’s superior earnings profile.
Both of the companies use less financial leverage but Green Brick debt-to-equity ratio is marginally higher at 0.19 compared to Pulte’s 0.16 indicating Pulte Group’s relies less on debt reinforcing its position as the more profitable.
DFCF Based Valuation
Based on the company’s FCF growth for the last 10 years the company seems to be undervalued at its current market price of $80 per share. As the interest rate are expected to come further down we apply a conservative discount rate of 12% considering the risk in real estate industry, its fair value based on FCF growth suggests to be $202 per share.
Catalyst Driving the company to its fair value
Green Brick maintains industry leading gross margin, strong cash generation as well as operational flexibility that help defend profitability. Additionally, the company’s disciplined balance sheet and financial flexibility are additional catalysts with lower leverage Although the company recently reported negative free cash flow mainly due to heavy investment in land acquisition as well as development to support its future projects rather than weak performance the company can manage its operations efficiently because it has low leverage, strong liquidity and access to financing.
Investor David Einhorn chose Green Brick Partners as a core investment as it fits his value investing strategy of buying high quality companies at an attractive valuation with strong long-term growth potential. He was directly involved in forming the company during the financial crisis by acquiring inexpensive land and partnering with builders, creating a platform positioned to benefit from the housing recovery as well as population growth in high demand markets such as Texas and Florida.
In addition, strategic expansion through its high-quality land portfolio in constrained, high market demand underpins future revenue growth. long-term housing market dynamics including homebuilding, demographic demand as well as Sunbelt markets. Furthermore, the company recorded net new orders and low cancelation rates signaling underlying demand stability which supports future revenue visibility. Most recently the board of director authorized a new share repurchase program of up to $150 million which will begin once the company has finished buying under its prior $100 million program. These buybacks demonstrate the company’s ongoing commitment to return capital to its shareholders and reduce share count.
Additionally, the Trump administration is pushing for changes in regulations related to environment wetland as well as other zonal and land use policies to stimulate the real estate sector as well as the Trump has repeatedly pressured the FED to further cut down the interest rates with the aim of stimulating the economy.
Policy directions under the Trump administration such as rolling back environmental as well as wetland regulations such as narrowing clean water Act, easing zoning and land use constraints and advocating lower interest rates could also materially affect the U.S real estate industry by reducing development cost, expanding the supply of buildable land and speeding up permitting, which all benefits homebuilder through higher volumes and improved project economics potential tax incentives or subsidiaries would further support demand and investment.
Share Repurchase Program
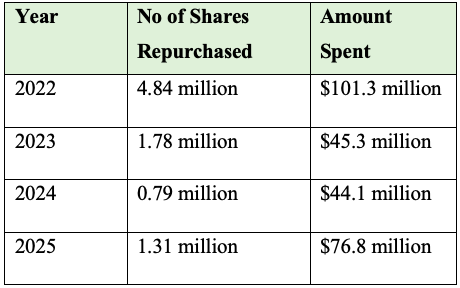
Note: 2025 figures reflect reported activity through Q3 and may increase by year-end
Between 2021-2025(TTM) the company has consistently used share repurchases at an average price of $30 per share as a key capital allocation tool to enhance shareholder value as well as reduce its outstanding share count. The company accelerated repurchases beginning in 2022 when it bought back approximately 4.84 million shares marking an aggressive year of capital return. This momentum continued in 2023 with around 1.78 million shares repurchased followed by 795,178 shares indicating a lower average repurchase prices and management’s confidence in fair value. Furthermore, the company repurchased approximately 1.31 shares in 2025(TTM) and additional authorization remains in place indicating ongoing commitment to buybacks.
Key Risks Facing Green Brick Partners
The company operates in the highly cyclical residential homebuilding industry which exposes it to significant macroeconomic as well as market risks. Demand for houses is sensitive to changes in employment levels, interest rates as well as consumer confident and the availability of mortgage financing. Tighter lending standards, Rising mortgage rates or reduction of government support mortgage programs could reduce affordability as well as cancelation rates. The company relies on third-party subcontractors for land development and construction making it vulnerable to labor availability, performance issues as well as delays that could negatively affect project timing, profitability and quality.
Green Brick’s long-term performance depends on its ability to acquire as well as develop suitable land at attractive prices in a super competitive environment which is subject to zoning, regulatory constraint, environment and entitlement.
Additionally, the company faces risk related to high competition from larger and better capitalized homebuilders.
Furthermore, tariffs on key construction inputs such as lumber, aluminum, Steel and building components have increased development and renovation costs squeezing developers margins as well as delaying projects. These higher input costs, combined with tight labor markets and persistent inflation such factors have made new construction less attractive particularly for residential as well as commercial projects with fixed pricing.
Tariffs on imported building materials like lumber, steel and appliances have raised material costs across the homebuilding industry adding approximately $10,000 – $11,000 to the cost of an average new home which can compress margins or force higher prices on buyers. For Green Brick Partners management has noted while tariffs contribute to higher input cost the company works with suppliers to mitigate the impact. The company doesn’t publicly disclose its key suppliers it works with major building products manufactures such as James Hardie Building Products Inc which supplies fiber-cement siding and trim products under and exclusive multi-year agreement through 2028.
Conclusion
Green Bricks Partners stands out as a high-quality undervalued homebuilder with a compelling combination of operational excellence, strategic land control as well as prudent financial management. While it operates in a cyclical and highly competitive industry subjected to macroeconomics as well as regulatory risks, the company’s vertically integrated platform, conservative balance sheet and focus on supply constrained, high demand markets provide meaningful downside protection. However, the company faced some short-term challenges recently including declining retained earnings, negative FCF and a reduction in its cash position primarily due to heavy investments in land and development to support future growth despite such challenges, Green brick’s strong margins, sizable backlog, stable order trends, as well as shareholder friendly capital allocation strategy reinforce confidence in its long-term earning power. Furthermore, the company potential catalysts include lower interest rates, regulatory easing, as well as sustained housing demand and continued share repurchases creates a favorable set up for multiple expansion as well as value realization.
Disclaimer
The information provided by Moods Investment Research is for general informational and educational purposes only. It is not intended as, and does not constitute, financial, investment, tax, legal, or other advice. The content is not a solicitation or recommendation to buy, sell, or hold any securities or investment strategies.
All opinions expressed are based on current analysis and are subject to change without notice. While we strive for accuracy, Moods Investment Research
makes no representation or warranty as to the completeness, accuracy, or reliability of any information provided. Investing involves risk, including the possible loss of principal. Past performance is not indicative of future results. You should conduct your own research and consult with a qualified financial advisor before making any investment decisions.
Moods Investment Research and its founders, directors, or affiliates are not liable for any losses or damages arising from any reliance on the information provided.
The views expressed in this article are those of the author(s) and do not constitute investment advice. The author does not hold a position in Green Bricks Partners However, the author(s), including any editors or contributors (collectively referred to as “Moods, directors, and analysts”), may or may not hold positions in other securities mentioned. Any such holdings are subject to change without notice.
Artificial intelligence (AI) technologies were used to support data processing, drafting, and/or analysis in this report. All conclusions and recommendations reflect the author’s independent judgment. While care has been taken to verify all information, neither the AI tools nor the authors guarantee accuracy or completeness. Therefore, whilst results derived from AI were reviewed for reliability; however, users should independently verify critical information.