
Equity Analyst- Maha Farooq
Sep 1, 2026

Investment Thesis
Oracle Corp (ORCL) is currently significantly overvalued at its current price. However, it has evolved from being a classic player in the database software industry to a highly promising firm dealing in cloud computing and artificial intelligence infrastructures. Its cloud infrastructure business has been a key pillar of growth due to increased demand for cloud computing and artificial intelligence infrastructures, data center’s storage space and massive computation capabilities. However, the company faces the risk that its heavy investment in cloud infrastructure as well as data centers may take much longer than expected to generate sufficient returns. If AI and cloud demand does not grow as expected these investments could place pressure on FCF, profitability and shareholders return.
Besides having a balanced business model that includes loyal clients in diverse sectors including education, retail, banking and health care as well as governments; the investors must bear in mind that the company is trading at a premium to its fair value in addition to having high leverage, capital expenditure, increasing debt levels, and high stock compensation cost that might pose some challenges to their returns in the short run
Company Overview & Business Model
Oracle is a giant software and tech company started in 1977.The company is based in Austin, Texas. It offers multiple services that help businesses with their information technology. The company offers database systems, cloud services as well as other multiple applications that businesses require to operate. Additionally, Oracle provides support services, helping its client to work effectively.
The company generates revenue through cloud services and license support including subscriptions for cloud infrastructure, technical support service and applications. Additionally, the company earns stable income from software licenses, consulting services and hardware products that support businesses implement and manage their systems. Moreover, its products are designed for specific industries such as finance, retail, education, healthcare and government, allowing companies to manage, store and analyze huge amount of data efficiently. The company’s customers include Bank of America, Zoom Video Communication, FedEx, many more. Oracle’s business model emphasizes long-term customer relationships by integrated technology solution, continuous updates to its cloud platform, recurring subscription-based revenue and enterprise applications.
Oracle remains the global leader when it comes to database technology through Oracle database, Java, middleware and MySQL products.
Segment Overview
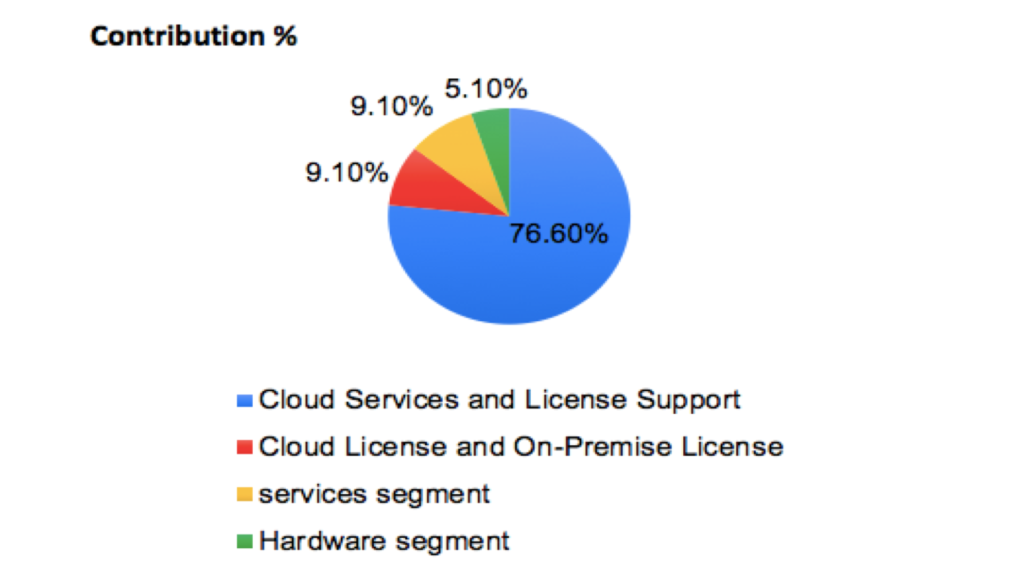
Oracle generated total revenue of $57.4 billion in 2025 with business heavily dominated by its cloud and software operations.
The company’s largest segment is Cloud Services and License Support which represents approximately 76.7% of total revenue and generated a revenue of $44 billion in 2025. This segment includes Oracle’s cloud infrastructure, database support service and cloud application. Its strong growth indicates increasing enterprise demand for AI infrastructure, subscription-based software solution and cloud computing.

Source: Company’s 10k Report
Another important segment includes Cloud License and On-Premise License which generated a revenue of approximately $5.2 billion in 2025, representing a contribution of 9.1%. This segment includes new software license sold for on-premise systems and certain cloud licensing products.
Source: Moods Investment Research
Oracle’s services segment contributes of about 9.1%, generating a revenue of $5.23 billion in 2025. This division include training, customer support system, consulting that help multiple businesses implement and manage oracle systems. While this segment contributes smaller portion of revenue it still remains important because it strengthens customer relationships and supports adoption of Oracle’s cloud products.
The company’s Hardware segment contributes about $2.94 billion in 2025 representing 5.1% of total revenue. This segment includes Oracle servers, engineered hardware products and storage system. The company has strategically focused more on cloud software and infrastructure services rather than physical technology products.
Financial Analysis
Revenue & Net income
The company’s revenue increased from $40.48 billion in 2021 to $57.40 billion in 2025 suggesting an increase of 41.8%. The company’s growth was modest between 2021-2022 it increased significantly in 2023 reaching to $49.95 billion and continued to rise suggesting the company expanded its operations.
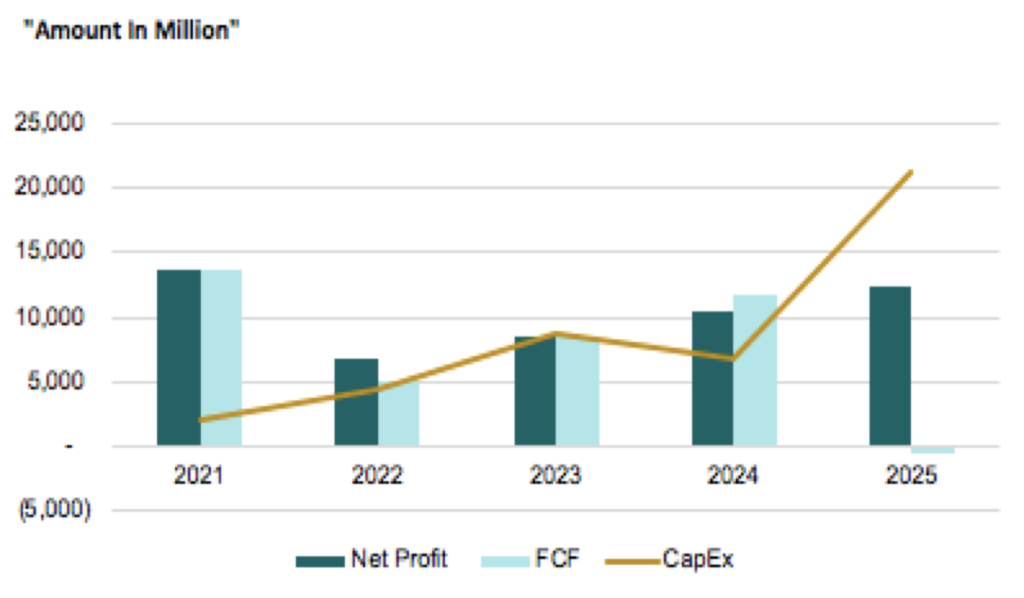
Oracle’s net income was highly volatile between this period. It significantly dropped from $13.75 billion in 2021 to $6.72 billion in 2022 a decrease of 51%. This sharp drop was likely due to increased investments, operating expenses as well as restructuring costs. Moreover, net income reached to $8.50 billion in 2023 recovering steadily and reaching $12.44 billion in 2025 suggesting the company recovered and returned to its 2021 profit level.
Source: Moods Investment Research
FCF Analysis
The company’s FCF was volatile between this period, it declined from $13.75 billion in 2021 to $5.03 billion in 2022 a decrease of 63.4% due to lower operating cash flow as well as investments in business operations. Although, it increased to $8.47 billion in 2023 and $11.81 billion in 2024, it sharply declined to negative $394 million in 2025 due to strategic growth initiatives and investments in infrastructure.
Debt & Capital Expenditure Analysis
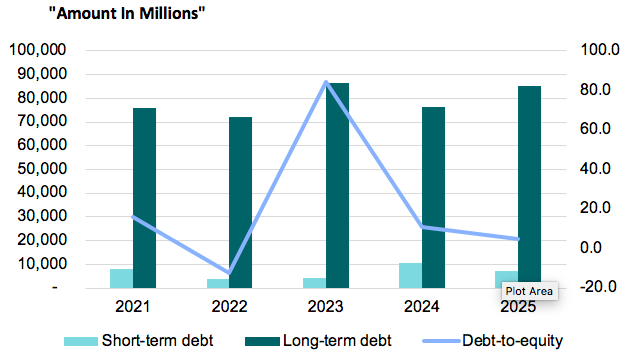
The company’s total debt increased from $84.25 billion in 2021 to $104 billion in 2025. Total debt spiked from 2023 onwards, this significant increase indicate Oracle relies more on debt financing to support investments and its operations
Source: Moods Investment Research
Additionally, Capital Expenditure increased significantly, it increased from $2.14 billion in 2021 to $ 4.5 billion in 2022 and further reached to $21.2 billion in 2025. This sharp increase was mainly due to investments in data centers, cloud infrastructure as well as tech assets to support company’s future growth.
Comparison Analysis
| Metrics | Oracle | SAP |
| Market Cap | $529.57 billion | $199.63 billion |
| P/E | 38.14 | 34.16 |
| ROE% | 85.36 | 16.81 |
| ROA% | 8.04 | 10.47 |
| ROIC% | 9.95 | 10.88 |
| Debt-to-equity | 5.09 | 0.17 |
| Debt-to-asset | 0.69 | 0.11 |
| EPS | 4.34 | 2.77 |
| FCF margin % | -0.69 | 22.87 |
Oracle and SAP are world’s leading enterprise software companies but significantly different in their financial performance. Oracle has a larger market cap compared to SAP’ s, indicating that investors place a higher overall value on Oracle.
Oracle has a P/E ratio of 38.14 compared to 34.16 of SAP’s suggesting the investors expect stronger future growth from Oracle.
In terms of profitability Oracle outperforms SAP in ROE. However, high ROE is influenced by usage of heavy debt financing. SAP has a better efficiency in utilizing its invested capital and assets with ROA of 10.47% and ROIC of 10.88% compared to 8.04% ROA and 9.95% ROIC of Oracle.
Oracle has a significant high debt-to-equity ratio indicating heavy reliance on debt financing. In contrast, SAP maintains a much more conservative capital structure, suggesting lower financial risk and financial stability.
Oracle generated higher earnings with an EPS of 4.34 compared to 2.77 of SAP’s, However, SAP outperformed Oracle in terms of cash generation with an FCF margin of 22.87% while Oracle recording a negative FCF margin of -0.69% largely due to substantial capital expenditure in 2025.
Stock Based Compensation Analysis
Oracle carries a higher SBC expense compared to SAP, reflecting its more aggressive use of equity incentive to attract and retain employee particularly in its Cloud and AI businesses, as of 2025 the company reported $4.67 billion in stock-based compensation compared to SAP’s $1-1.2 billion.
Oracle’s stock-based compensation represent about 8.1% of total revenue while SAP’s SBC represent 2-3% of its revenue base, suggesting Oracle relies much more heavily on share-based rewards compared to its competitor. High SBC reduces shareholder value if it continues to grow rapidly.
DFCF Based Valuation
The intrinsic value of the company was estimated using the DFCF model based on the FCF growth over the last five years. The company estimates a fair value of $29.84 per share assuming a 12% discount rate. The company’s current market price is higher than its fair value, hence the stock appears to be significantly overvalued, indicating the investors are paying more than its fundamental worth. This suggest high market expectations for future growth and a possible risk of a price correction if Oracle does not meet those expectations.
Key Catalysts
The company’s key catalysts center on the growth of its Oracle Cloud Infrastructure segment with revenue growing 68% year-over-year and a staggering $553 billion remaining platform obligation backlog built on multiyear AI contracts with OpenAI, Meta as well as XAI. This strategy helps the company’s deeply embedded enterprise relationships where switching costs keep large customers locked in.
Oracle has raised its quarterly dividend by 25% to 0.50 per share. Though share buybacks have been scaled back significantly to $95 million in the first half of 2026 as capital is redirected towards the company’s aggressive AI data center expansion.
As the company is aggressively investing in AI data centers as well as Oracle cloud infrastructure to meet high AI demand, similar to other competitors such as Meta, Microsoft and Amazon. Although these investments are temporarily resulting in negative FCF, they are expected to generate long-term higher returns.
Oracle revenue might reach $104 billion by FY2029 representing a 54.3% increase as per company’s guidance.
Calculation
Step 1. Percentage increase = (104 – 67.4) / 67.4 x 100 = 54.3%
Revenue could potentially reach around $130-$135 billion by 2031 representing an increase of approximately $63-$68 billion from 2026 levels. As cloud infrastructure investments mature, net income is also expected to increase from $17 billion to approximately $28-$30 billion.
Previously, the company’s FCF margin before this investment cycle was approximately 30-35%
Revenue increase
Oracle’s target revenue
2026= $67.4 B
2029 = $104B
104 – 67.4 = 36.6B
The company’s FCF margin before these AI investments was between 20-25%, Since the company is heavily investing on data centers, Let’s assume once these investments mature, 20% of the additional revenue is converted into FCF
Step 2. Impact of AI investments on FCF
Formula
Additional FCF = Revenue growth x FCF margin
36.6 x 20% = 7.3 B
Therefore, the company could generate for about $7.3 billion additional annual FCF once its current investment phase matures.
Calculating the Terminal Value
Terminal Value = FCF x (1 + g) / r – g
Where
- FCF = 7.3
- Growth Rate = 3%
- Discount Rate = 10%
7.3 x 1.03 / 0.10 – 0.03
= 107.4 billion
Discount Back to today
Present Value = 107.4 / (1.10)5
= $66.7 billion
Per share Value
66.7B / 2.866B = $23.27 per share
The AI and cloud infrastructure investment cycle could add around $23 per share to oracle’s Intrinsic Value.
Oracles key business risks
The company faces a lot of risks that could affect how well it does in the long run. Oracle is in a competitive technology market. Big companies like Microsoft Azure, AWS Google Cloud have significant surplus cash and are quickly investing and expected to grow their database and cloud services, which challenges Oracle’s core business.
The company spends cash on AI as well as cloud infrastructure. However, there is no guarantee such investment’s will pay off if its client does not adopt them quickly or if its closed competitor come up with better services.
Oracle also has a lot of debt which makes it more vulnerable to rising interest rates and reduces its ability to make big investment decisions. In 2025 the company spent a lot of money on expansion and data centers, which resulted in negative cash flow and this could cause problems with generating cash in the short term even though it is good for the long term.
Oracle also spent a lot of money on stock-based compensation to keep its employees but this plan might reduce the value of the company’s stock and lower the quality of its earnings over time. Additionally, Oracle is at risk of cyber threats, data privacy regulations and new artificial intelligence laws, which could lead to compliance and reputational problems. If Oracles stock price continues to stay higher than its fundamental value, then investors also face the risk that the stock price might drop in the future.
Moreover, the company is facing legal and regulation risk, recently the company has been involved in security fraud class-action lawsuit related to disclosure about its AI infrastructure investments as well as capex plans. Previously the company settled a $115 million privacy lawsuit. If the company remains subject to ongoing antitrust scrutiny, intellectual property dispute risk of legal and reputational damage increases.
Conclusion
Oracle has shifted its business model from a traditional enterprise software provider to high growing cloud computing as well as AI industry. The company reported strong revenue growth between 2021-2025 while investing heavily in cloud infrastructure. Although, FCF & profitability experienced high volatility due to heavy investments in multiple segments such as data Centre’s, expenditures are strategic and aimed to support the company’s future growth. However, other factors such as increasing debt and high stock-based compensation expenses as well as overvaluation indicate that investors remain cautious. The company demonstrates stronger earning generation compared to its competitor, but carries high financial risk due to heavy reliance on debt.
Disclaimer
The information provided by Moods Investment Research is for general informational and educational purposes only. It is not intended as, and does not constitute, financial, investment, tax, legal, or other advice. The content is not a solicitation or recommendation to buy, sell, or hold any securities or investment strategies.
All opinions expressed are based on current analysis and are subject to change without notice. While we strive for accuracy, Moods Investment Research makes no representation or warranty as to the completeness, accuracy, or reliability of any information provided. Investing involves risk, including the possible loss of principal. Past performance is not indicative of future results. You should conduct your own research and consult with a qualified financial advisor before making any investment decisions.
Moods Investment Research and its founders, directors, or affiliates are not liable for any losses or damages arising from any reliance on the information provided.
The views expressed in this article are those of the author(s) and do not constitute investment advice. The author does not hold a position in Oracle However, the author(s), including any editors or contributors (collectively referred to as “Moods and directors”), may or may not hold positions in other securities mentioned. Any such holdings are subject to change without notice.
Artificial intelligence (AI) technologies were used to support data processing, drafting, and/or analysis in this report. All conclusions and recommendations reflect the author’s independent judgment. While care has been taken to verify all information, neither the AI tools nor the authors guarantee accuracy or completeness. Therefore, whilst results derived from AI were reviewed for reliability; however, users should independently verify critical information.