
Equity Analyst- Maha Farooq
Sep 1, 2026

Investment Thesis
Nike Inc (NKE) is currently trading at a substantial discount to its intrinsic value despite remaining the global largest athletic footwear and apparel company with one of the strongest customer brands globally. Based on the DFCF valuation the organization’s estimated fair value is $60.75 per share compared to its current share price of $42.90 suggesting an upside potential of about 42%. The organizations investment case is backed by multiple powerful catalysts. One of the majors is appointment of Elliott Hill as CEO marks a strategic turning point with management focusing on product innovation, improving inventory management, rebuilding wholesale relationships as well as strengthening key categories such as women’s apparel, running and basketball. The company possess significantly competitive advantages including a global distribution network spanning, unmatched brand recognition as well as one of the largest athlete endorsement portfolios in the industry.
Despite weaker earnings, Nike maintains a healthy balance sheet with declining debt, substantial cash reserve, good operating cash flow as well as ongoing commitment to shareholder returns through future share repurchases and dividends.
Company Overview
NIKE, Inc. Designs, markets and distributes sporting footwear, gear, clothing and accessories globally. The organization was established in 1967 and has its headquarters in Beaverton, Oregon. Some of the most notable brands of NIKE include Nike, Jordan and Converse. The company sells its products in over 190 countries through its retail stores, wholesale distributors and websites.
Source: Company’s 10k report
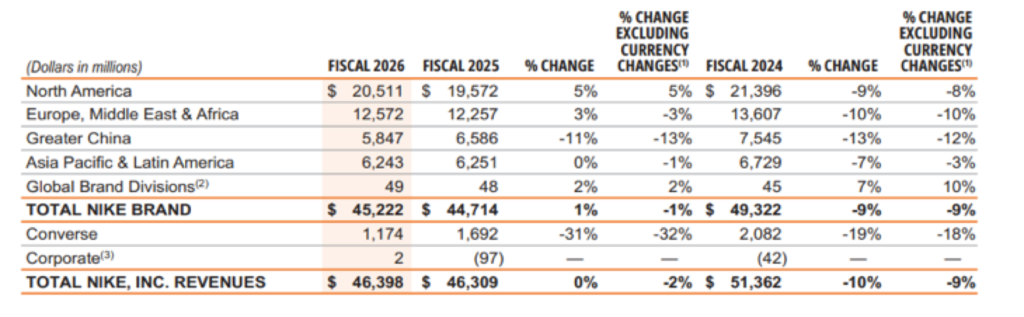
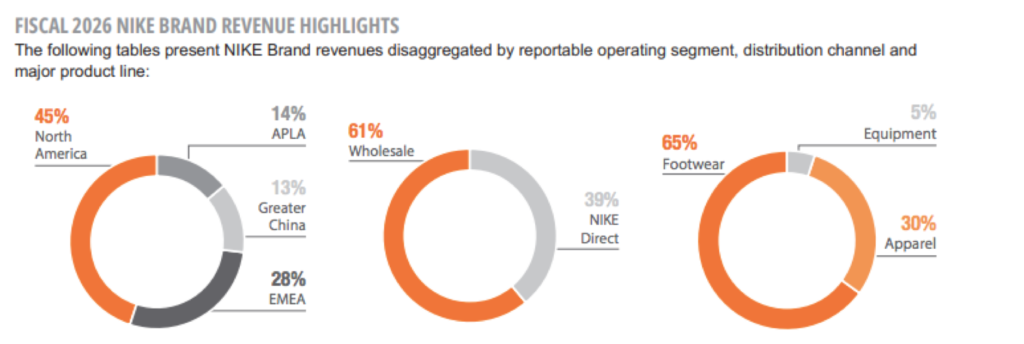
Nike’s revenue was almost unchanged from 2025 to 2026. North America remained Nike’s largest market, generating a total revenue of $20.5 billion and growing 5%, indicating strong demand in its home market. On the other hand, EMEA also slightly increased by 3% to $12.6 billion. However, Greater China was the weakest region with revenue declining to $5.8 billion, about 11% showing continued challenges in the Chinese market. APLA remained stable at $6.2 billion. Converse revenue sharply fell from $1.7 billion to $1.2 billion about 31%. The company’s revenue is being supported by North America, while Converse and China are major area of weakness. This suggest that Nike still has strong core business but needs to improve its performance in weaker markets to return to stronger growth.
Nike’s main focus is on continuous strong brand recognition, innovation and extensive marketing to maintain its leadership in sport industry.
Nike is experiencing a significant fall from its previous market leadership. Investors are more concerned about the company’s lack of innovation and capital allocation priorities. While Nike continues to heavily invest on sponsorships, athlete endorsements, and global advertising campaigns. The company spent about $.75 billion on Demand Creation in 2026, which includes advertising, marketing, sports marketing as well as payments under athlete and other endorsement contracts. However, the company does not separately disclose the exact percentage amount paid to athletes but it confirms that endorsement payments form a significant portion of promotional expenses.
These significant expenditures have not yet translated into the same level of revenue growth in last 5 years at least. Nike’s closed competitors such as Adidas and Hoka have introduced multiple innovative footwear and successfully captured market share reducing the company’s competitive advantage.
Source: Macrotrends
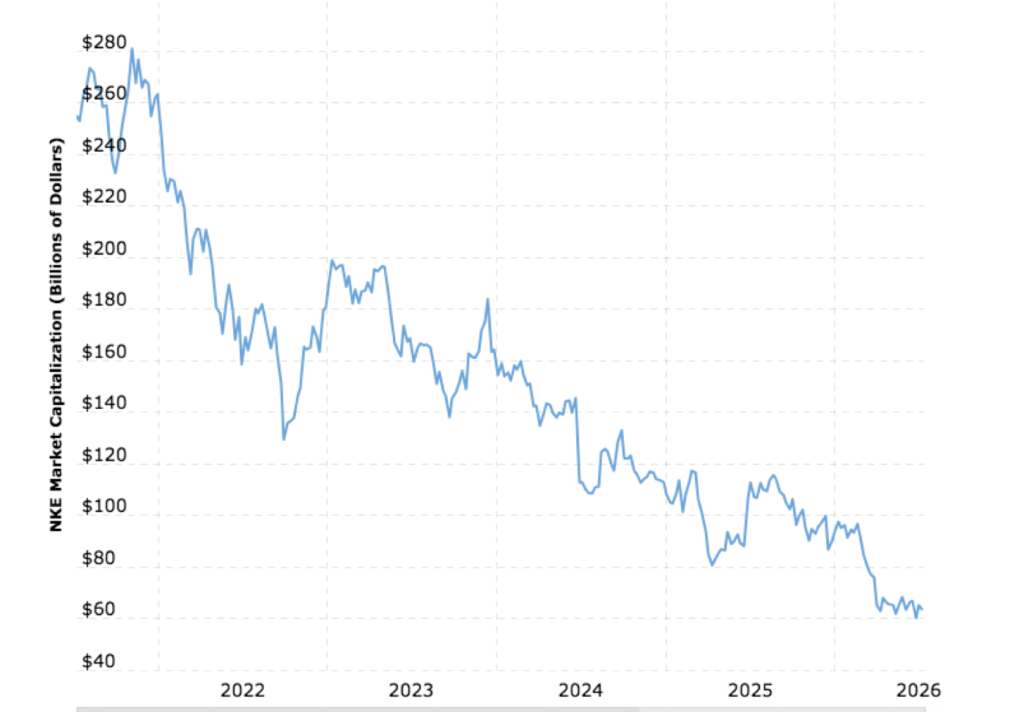
Nike’s Market Cap has followed a downward trend between 2021 to 2026. It has declined from $275 billion to approximately $70 billion in 2026. This sharp decline was not sudden but occurred for multiple years suggesting investors remained cautious about its long-term growth prospects. The company could potentially become an acquisition target because of exceptional value of its Nike, Jordan brands, global distribution network and strong consumer recognition at this price. However, currently there is no confirmed takeover offer or evidence that Nike is actively seeking to sell the company. On the other hand, a realistic possibility is restructuring through the sale of divestiture of weaker brands such as Converse has attracted speculation because of its declining performance.
Strategic Missteps behind Nike’s Recent decline
Nike has faced multiple challenges due to strategic decisions that weakened the organization’s competitive position.
One of the most critical mistakes was the heavy reliance on direct-to-consumer strategy while reducing partnerships with wholesale retailers such as Foot Locker, DSW and Macy’s. Although the company’s this initiative improved profit margins, it reduced the company’s presence and allowed competitors to gain shelf space and attract customers, Additionally, the company focused heavily on lifestyle classics such as Jordan models, Dunk and Air Force 1 instead of consistently introducing innovative performance footwear, as teenagers’ preferences shifted toward running, comfort, while Nike’s product pipeline lacked excitement.
Moreover, the company invested billions of dollars in celebrity endorsements as well as global marketing campaigns instead of investing in meaningful product innovation and research and development making Nike’s marketing-led strategy less effective.
Financial performance over last 6 years
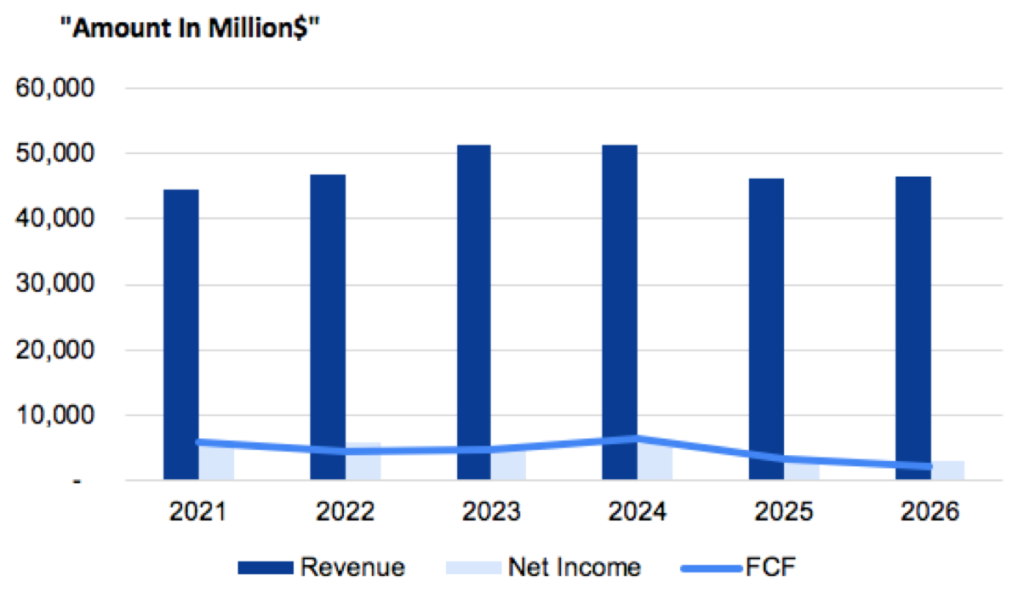
There has been a declining trend in the sales figures for Nike in the last couple of years, illustrating the problems that are being faced by the company in its pursuit of growth. The sales have risen from $44.5 billion in 2021 to $51.4 billion in 2024. However, there has been a marked decline in the rate of growth, dropping to $46.3 billion in 2025 and $46.39 in the latest year.
Source: Company’s 10k Report
Additionally, the company’s cost of revenue remained high in all years $25 billion in 2021 to $27 billion in 2025 and $26.48 billion in 2026 due to rising manufacturing, raw material, freight and labor cost. Despite heavy spending on global advertising campaigns, athlete endorsements and sponsorships, these costs continue to put pressure on the company’s gross margins and profits.
Source: Moods Investment Research
The Net Income was $5.07 billion in 2021 and increased to $6.05 billion in 2022. But the company’s net income plunged back to $5.07 billion 2023 owing to rise in input cost, surplus stock and inflationary forces. The net income bounced back to $5.70 billion in 2024 and plunged drastically to $3.22 billion in 2025 showing a decline of 43% or more than the previous year. The major reasons for this sharp plunge were the heavy discounting on surplus stock, slow consumer demands, high restructuring cost and rise in operational cost. It went further down to $3.11 billion in 2026 showing that the company was struggling to get back into profitability.
The free cash flow fell sharply from $5.96 billion in 2021 to $3.27 billion in 2025 and to $2.18 billion in 2026.This shows a combination of weaker operating cash flow, continued investment requirement as well as lower profitability and pressure of working capital.
Debt Analysis
The total debt of Nike has been consistent from 2021 to 2026. Debt decreased from $12.81 billion to $11.03 billion during this period. This consistency of decrease indicates that the company has been managing its debt in a responsible manner by not borrowing frequently. Lower risk levels help reduce financial risk and strengthening the company’s balance sheet. However, despite this improvement the Nike’s declining net income as well as weakening FCF suggest that debt reduction alone has not been sufficient to improve overall financial performance.
Comparative financial Performance
| Metrics Amount in US$ | Nike | Adidas (TTM) | Decker’s Outdoor Corp | ASICS (TTM) |
| Market Cap | $64.92B | $32.66B | $12.78B | $23.4B |
| ROE% | 22.14 | 24.87 | 40.86 | 42.99 |
| ROIC% | 14.1 | 10.85 | 96.26 | 35.52 |
| ROA% | 8.29 | 7.02 | 7.29 | 20.91 |
| P/E Ratio | 22.01 | 23.13 | 14.26 | 41.04 |
| Debt-to-Equity | 0.74 | 0.99 | 0.15 | 0.28 |
| EBITDA Margin % | 9.9 | 13.14 | 25.67 | 21.84 |
| EPS | 2.1 | 4.55 | 7.02 | 0.82 |
| Dividend Yield % | 3.5 | 1.59 | – | 0.3 |
| Net Income Margin% | 6.7 | 5.51 | 18.71 | 13.5 |
Nike is the largest company among the competitors, with a market cap of $64.92 billion. However, Nike’s larger size does not translate into the strongest efficiency or profitability. Nike’s ROE is lower than all of its competitors indicating that its competitors are generating higher returns from shareholders equity. Similarly, Nike’s ROIC of 14.1% is stronger than Adidas but significantly below compared to others. Nike’s ROA is slightly higher than Adidas and Decker’s but well below ASICS, suggesting that ASICS is more efficient in generating profits from its assets.
In terms of valuation Nike is valued more reasonably relative to its earnings than its competitors. However, Decker’s has the lowest P/E ratio of 14.26 indicating it is cheaper based on earnings. Nike has a high debt-to-equity ratio compared to Decker’s and ASICS but Adidas has much higher leverage. Nike’s EBITDA margin and net income margin are weaker than Decker’s and ASICS.
On the positive side Nike offer highest dividend yield at 3.5% compared to others. Nike needs to improve operational efficiency as well as profitability to strengthen its competitive advantage.
FCF Based Fair Valuation
Based on the DFCF valuation, the company’s estimated fair value is $60.75 per share using a discount rate of 12%. Compared with the current market price of $42.90 this suggests Nike is significantly undervalued by about 41.6%. This might indicate the market may be undervaluing the company’s long-term earnings as well as cash flow potential. Despite recent operational challenges.
Nike Under Elliot Hill Is Positioned for a Successful Turnover
Multiple catalysts that will help the organization drive its share prices towards its estimated fair value of $60.75. One of the major catalysts is, Nike has undergone a major leadership transition with the appointment of Elliott Hill as CEO, bringing back an experienced executive with deep knowledge. Under his leadership the organization’s management is mainly focused on accelerating product innovation, building strong relationships with wholesale partners as well as strengthening its direct-to-consumer strategy, which will reduce excessive inventory; additionally, improve execution across key product categories such as basketball, running and women’s apparel. Moreover, these strategic initiatives are expected to increase revenue generation as well as improve profitability over the medium term. Furthermore, Nike continues to generate strong FCF, invest in digital capabilities and marketing which will provide additional long-term growth opportunities.
Nike expects 2027 to mark the beginning of sequential improvement after absorbing the largest financial impact of its “Win Now” initiatives in 2026, despite these challenges the organization have generated $5.4 billion in operating cash flow and 411.5 billion in cash and short-term investments allowing the company to invest in innovation, marketing and digital capabilities while continuing shareholder returns. The company is also rebuilding its relationships with key wholesale partners after years of emphasizing direct-to-consumer sales, which the management believes will expand distribution, consumer sale as well as restore market share. Furthermore, the company is increasing investment in demand creation and innovation across sportwear, women’s apparel, running with leveraging major events such as 2025 FIFA world Cup to increase customer engagement.
Such initiatives combined with product improvement are expected to drive the company towards its fair value in short to medium term.
Shareholders Return Through Dividends and Share Repurchases
The company has consistently showed a strong commitment to creating value for its shareholders through a balanced approach that includes both dividend payments and share repurchases. Nike has increased its annual dividend showing management’s confidence in the company’s long-term earnings potential. According to recent reports for 2026 the company paid out about $2.4 billion in dividends representing 5% increase compared to 2025. Traditionally the company has been very active in purchasing back its own stocks and in 2025 it purchased $3 billion worth of stock. However, the figure fell down to $123 million in 2026 when management was temporarily focused on conserving cash in the light of turnarounds in company under Elliott Hill. Nevertheless, at the moment, there is $5.9 billion left within the scope of its authorized share repurchase program.
Risks Associated with Nike Business
There are several different risks associated with the business of the company and can negatively affect both financial performance and future growth of the company. First of all, it is an industry risk as Nike operates in very competitive environment and it needs to compete against such big players as Puma, New Balance, Adidas, and Lululemon. Second, the company operates in very competitive industry and it requires constant investments into product development and marketing. Additionally, it has a risk related to demand forecast as fluctuating fashion trends and customer preferences may create excess inventories leading to high discounts. Nike is sensitive to macroeconomic conditions including inflation, currency fluctuations, high interest rates as well as customer spending’s particularly. Moreover, factors like geopolitical tensions, trade barriers, and tariffs may increase costs in production since the company relies on the work of independent contractors. As predicted for the year 2026, the production share of Nike branded footwear will be around 52% in Vietnam, 27% in Indonesia, and 16% in China. The geopolitical issues experienced currently may subject the firm to disruptions within its supply chain.
Furthermore, another major risk includes the company’s growing dependence on technology and digital platforms. Cybersecurity breaches, and data privacy issue could significantly impact operations, damage customer trust and result to regulatory penalties adding to its already much higher costs.
Nike’s success highly depends on maintaining its premium brand image. These key risks highlight the importance of supply chain management, digital security, continuous innovation and brand protection in sustaining Nike’s competitive position.
Conclusion
To sum up, Nike is a strong company with globally recognized brand, but currently facing challenges in revenue growth, innovation, market share and profitability due to increased competition from newer brands. The significant decline in FCF and net income in recent years highlight the need for a successful turn over. However, the organizations strong balance sheet, brand strength and experienced leadership under Elliott Hill and reduced debt provide solid foundation for recovery.
Under his leadership the company renewed focus on innovation, wholesale partnership. Based on DFCF valuation the company estimated fair value of $60.75 per share compared with current market price of $42.90 suggesting 41.6% upside potential in the shot to medium term. On the other hand, significant risk remains due to increased competition, cybersecurity concerns, changing consumer preferences and geopolitical as well as supply chain risks. The current valuation appears to reflect many near-term challenges however, despite these challenges, the company presents a potentially attractive long-term investment opportunity due to a recent decline in its market cap and historically a significantly lower price.
Disclaimer
The information provided by Moods Investment Research is for general informational and educational purposes only. It is not intended as, and does not constitute, financial, investment, tax, legal, or other advice. The content is not a solicitation or recommendation to buy, sell, or hold any securities or investment strategies.
All opinions expressed are based on current analysis and are subject to change without notice. While we strive for accuracy, Moods Investment Research
makes no representation or warranty as to the completeness, accuracy, or reliability of any information provided. Investing involves risk, including the possible loss of principal. Past performance is not indicative of future results. You should conduct your own research and consult with a qualified financial advisor before making any investment decisions.
Moods Investment Research and its founders, directors, or affiliates are not liable for any losses or damages arising from any reliance on the information provided.
The views expressed in this article are those of the author(s) and do not constitute investment advice. The author does not hold a position in Nike. However, the author(s), including any editors or contributors (collectively referred to as “Moods and directors”), may or may not hold positions in other securities mentioned. Any such holdings are subject to change without notice.
Artificial intelligence (AI) technologies were used to support data processing, drafting, and/or analysis in this report. All conclusions and recommendations reflect the author’s independent judgment. While care has been taken to verify all information, neither the AI tools nor the authors guarantee accuracy or completeness. Therefore, whilst results derived from AI were reviewed for reliability; however, users should independently verify critical information.