
Ticker: RSKIA | Exchange: OTC (PNK) | Sector: Industrials
Prepared by: Moods Investment Research
Company Overview
George Risk Industries, Inc. (RSKIA) designs, manufactures, and sells various electronic components worldwide. Its product range includes computer keyboards, proximity switches, security alarm components and systems, pool access alarms, EZ Duct wire covers, water sensors, electronic switching devices, security switches, and wire and cable installation tools. Additionally, the company provides door and window contact switches, environmental products, liquid detection sensors, and raceway wire covers.
These products cater to residential, commercial, industrial, and government installations. The company’s primary customers include security alarm distributors, alarm installers, original equipment manufacturers, and distributors of off-the-shelf keyboards. George Risk Industries, Inc. was founded in 1965 and is headquartered in Kimball, Nebraska.
Financial Performance Analysis
Historical Financial Performance (2014–2024 TTM)
· Revenue CAGR (2014-2024): 7.3%
· Net Income CAGR (2014-2024): 12.5%
2024TTM
· Gross Margin: 49.6%
· Operating Margin: 28.6%
· Return on Invested Capital (ROIC): 8.2% (current). 10-Year Average ROIC:10.11%
· Dividend Yield: 5.8%
· Free Cash Flow (FCF) Yield: 7.8%
. Earnings Yield: 12.13%
. Net Current Asset Value (NCAV): $51.5M vs. $83.7M Market Cap. Most of its NCAV consists of liquid working capital, which may limit downside risk, assuming asset quality is strong
Abnormally High Profits in 2021
· PPP Loan Forgiveness: $950,000*
· Deferred Income Taxes: $1,988,000
· Unrealized Gain (Loss) on Equity Securities: $7,007,000
*Paycheck Protection Program Loan (PPP)
On April 15, 2020, the company secured a $950,000 loan (“PPP Loan”) from FirsTier Bank under the Paycheck Protection Program, which was established under the CARES Act on March 27, 2020. The PPP Loan, documented in a Note issued on April 15, 2020, carried an interest rate of 1% per annum and was set to mature on April 15, 2022. The loan proceeds were allocated to qualifying expenses. On December 3, 2020, the company received official notice of full loan forgiveness from the lender. Subsequently, in January 2021, it was determined that the forgiven amount was not taxable. The loan forgiveness is recorded under the “Other Income” section of the income statement.
Key Financial Strengths
· Strong Liquidity: The company holds $5.45 million in cash and $36.36 million in investments.
· No Significant Debt: Reflecting low financial risk.
· Consistent Profitability:
Q2 2024 Net Income: $2.215 million (compared to a $55,000 loss in Q2 2023).
Six-Month Net Income (2024): $4.92 million, up from $2.319 million in 2023.
· Increased Dividend Payments: The dividend was raised to $1.00 per share, up from $0.65 per share last year.
Preferred Stock
Each share of Series #1 preferred stock is convertible at the holder’s option into five shares of Class A common stock. Additionally, it is redeemable at the discretion of the board of directors at a rate of $20 per share. Holders of the convertible preferred stock are entitled to an annual dividend of up to $1 per share, payable quarterly as declared by the board.
Hidden Value: Cash, Investments & Property (2024 TTM)
· Cash & Short-Term Investments: $41.6M (68.4% of total assets).
· Property, Plant & Equipment (PP&E) + Land: $2.0M (3.3% of total assets).
· Net Debt Position: -$7.1M (No debt. These are simply payables, including accrued expenses, dividends, and deferred taxes. Since there is no actual debt, cash exceeds total liabilities.
· Investments: Equity and municipal bonds with unrealized gains of $10.9M.
1. Investment Portfolio Composition & Valuation
As of October 31, 2024, RSKIA holds $36.36M in investments at fair value, broken down as follows:
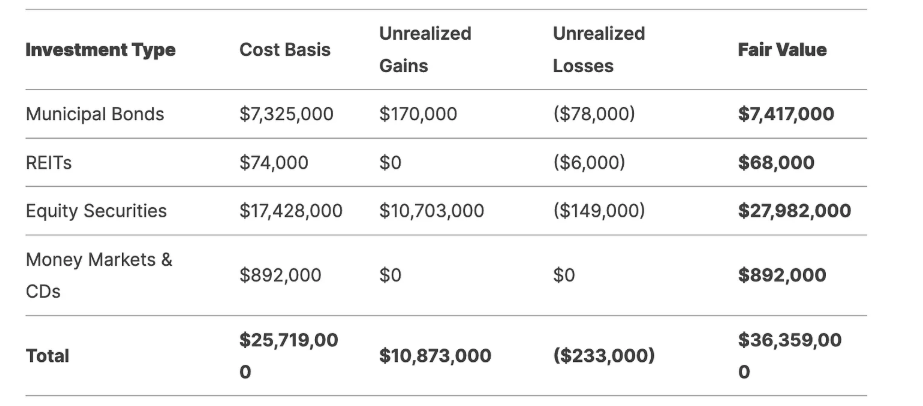
Key Observations:
Equity Securities Dominate: 77% of the portfolio (27.98M), with 10.7M in unrealized gains**.
Municipal Bonds: Stable but impacted by interest rate hikes ($78K unrealized loss).
Liquidity: $892K in cash equivalents.
Income Reliance: 50% of net income is market-dependent (risky but high-reward)
2. Income Contribution: Operations vs. Investments
For the six months ending October 31, 2024:
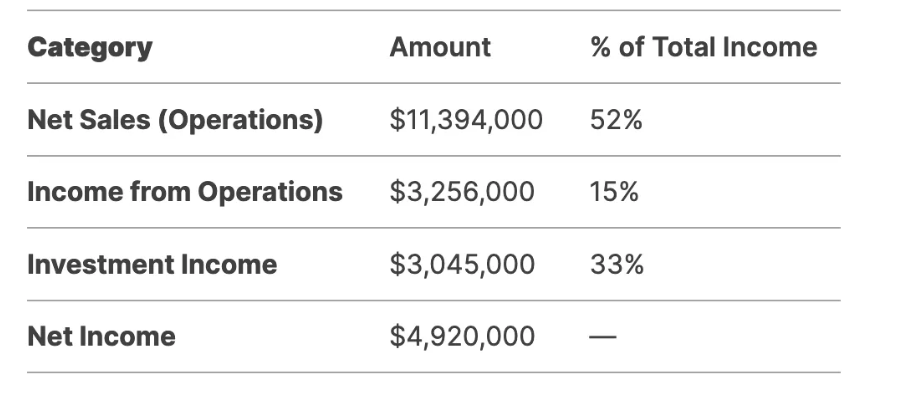
Breakdown of Investment Income:
Dividends & Interest: $616,000 (20% of investment income).
Unrealized Gains on Equities: $1,413,000 (46%).
Realized Gains (Investments): $549,000 (18%).
Solar Tax Credit: $373,000 (12%).
Critical Insight:
~50% of Net Income ($2.46M) is tied to investments (dividends, unrealized/realized gains, tax credits).
3. Performance of Investments
A. Realized Gains/Losses (6M 2024):
Equity Sales: 646,000 gains vs. 83,000 losses.
Debt Sales: 0 gains vs.14,000 losses.
Net Realized Gains: $549,000 (1.5% of portfolio value).
B. Unrealized Losses:
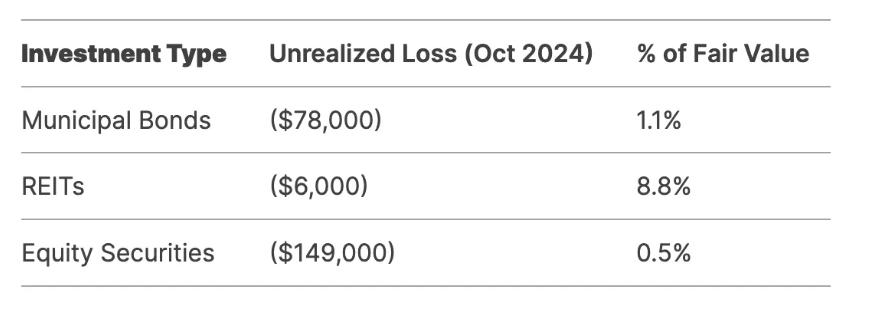
Management’s Stance:
Losses deemed not “other-than-temporary“ due to intent to hold until recovery.
Municipal bonds ($7.4M) are low-risk but sensitive to interest rates.
Valuation of Investments
Intrinsic Value Estimate:
Fair Value: $36.36M (as reported).
Upside: $10.7M unrealized gains in equities (potential liquidity if sold).
Downside Protection: $7.4M in municipal bonds (stable but low-yield).
Adjusted Book Value of operating business:
Total Assets: $60.78M (2024 TTM).
Investments + Cash: $41.6M (68% of assets).
Implied Business Value: 60.78M–36.36M = $24.42M (operations value).
Strengths & Opportunities
· Retained Earnings Growth: Increased from $32.4M (2014) to $56.8M (2024).
· Share Buybacks: Outstanding shares reduced by 2.7% since 2014 (2024 TTM diluted shares: 4.9M).
· Dividend Strength: Sustainable 5.8% yield with a payout ratio of 43.8%.
Intrinsic Value Estimate
· Free Cash Flow (FCF) Growth (10-Yr): 8.0% (historical average) → Terminal Growth: 3.0%.
. Weighted Average Cost of Capital (WACC): 7.5% (risk-adjusted).
Scenario
Fair Value/Share Upside vs. Current Price ($17)
Base Case: $27.50 61.8%
Bear Case: $20.00 17.6%
Bull Case: $35.00. 105.9%
· Margin of Safety: 38.2% (Current price vs. Base Case).
Investments provide a margin of safety (68% of assets in cash/securities)
Recommendation: Buy
1. RSKIA is partially industrial but operates in a niche sector (electronic components). It does manufacturing, but on a smaller scale compared to large industrial firms like Caterpillar or General Electric. It is not highly capital-intensive, making it different from heavy industrial firms.
RSKIA operates in a more specialized, high-margin niche but faces competition from larger electronics firms. Traditional industrial firms compete on economies of scale and long-term contracts.
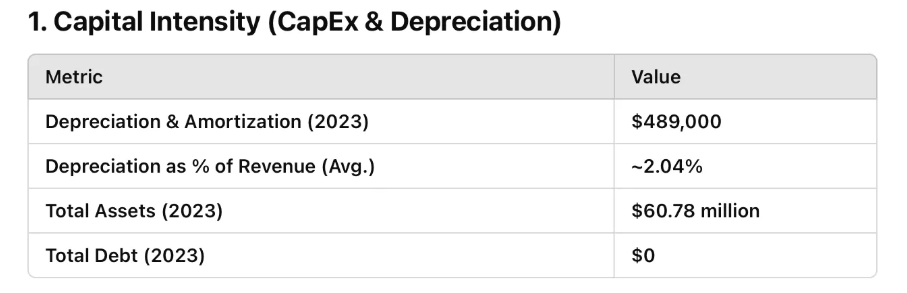
Depreciation as a % of revenue is very low (~2%), indicating that RSKIA does not rely heavily on large capital investments.
Total Debt = $0, meaning the company does not finance growth through borrowing, unlike capital-intensive industrial firms.
Low depreciation suggests that RSKIA is not capital-intensive like traditional industrial manufacturers.
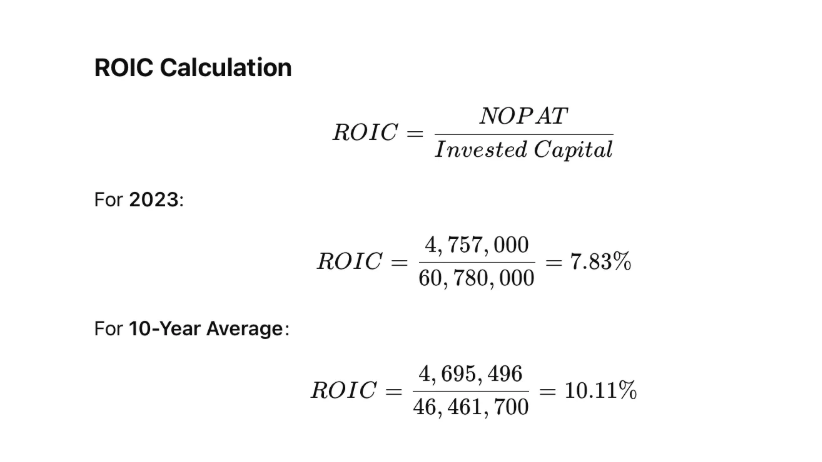
Key Financial Metrics for ROIC Calculation
1. Operating Income (EBIT)
2023 EBIT = $5,815,000
EBIT Margin (2023) = 29.1%
10-Year Average EBIT = $6,280,400
2. Tax-Affected EBIT (NOPAT)
2023 Tax-Affected EBIT (NOPAT) = $4,757,000
10-Year Average NOPAT = $4,695,496
3. Invested Capital
Total Assets (2023) = $60,780,000
Total Debt (2023) = $0
10-Year Average Total Assets = $46,461,700
Since RSKIA has no debt, we assume Invested Capital = Total Assets.
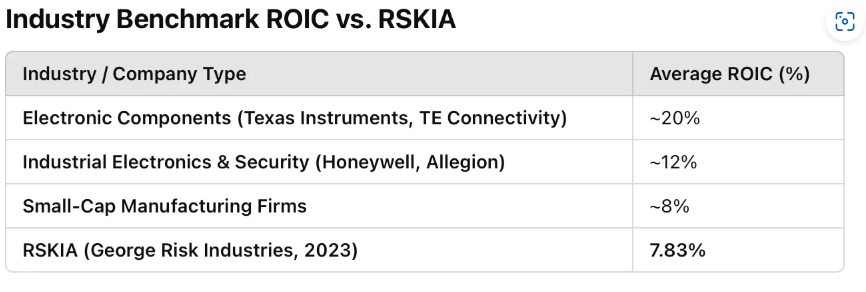
We’ll now compare RSKIA’s ROIC (~7.83% in 2023, 10.11% 10-year average) with industry benchmarks. Since George Risk Industries (RSKIA) operates in the electronic components and security products sector, we’ll compare it with:
Electronic Component Manufacturers (e.g., Texas Instruments, TE Connectivity)
Industrial Electronics & Security Companies (e.g., Honeywell, Allegion)
Small-Cap Manufacturing Firms
Key Takeaways
- RSKIA’s ROIC (~7.83%) is lower than the electronic components industry (~20%) because it operates in a niche, lower-margin segment.
- It is also lower than industrial electronics/security peers (~12%), likely due to its smaller scale and slower revenue growth.
- Compared to small-cap manufacturing firms (~8%), RSKIA is about average, suggesting it is not significantly underperforming for its size.
- Liquid Assets: Cash and investments total $41.6M vs. a market capitalization of $83.7M (You’re effectively getting approximately 50% of the market value in cash, with no debt. Think of it as owning a small private business)
3. Dividend Stability: Strong retained earnings support continued payouts.
4. Book Value: The stock trades at 1.5 to its book (P/B) and 8.2x price-to-earnings (P/E) vs. the industry average of 15x. It offers half of that in liquid cash with no debt obligations hence you have a sustainable business to own.
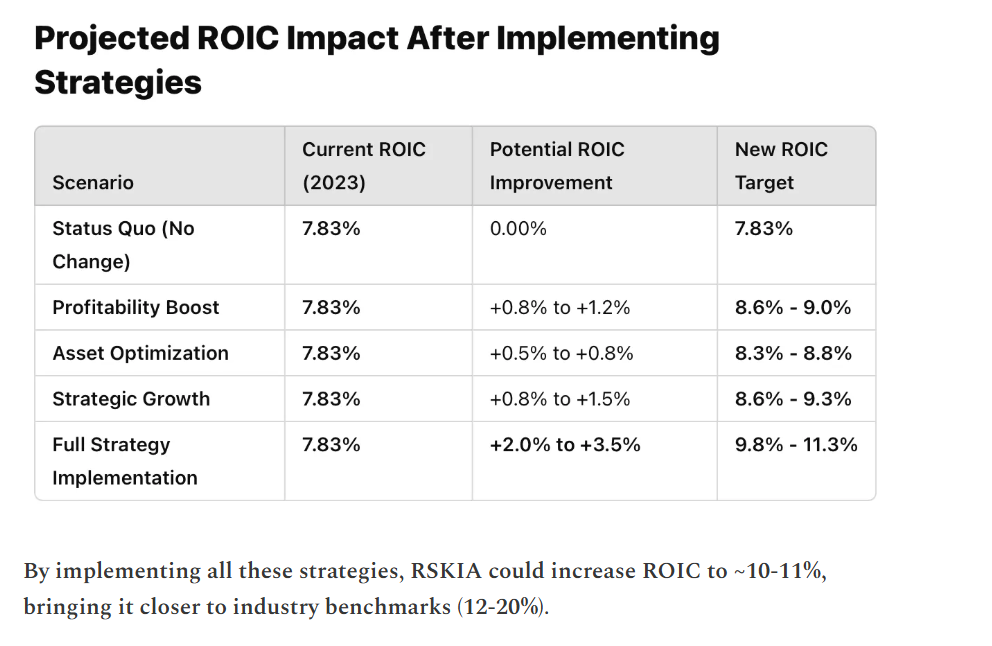
Catalyst: How can RSKIA Improve Its ROIC
- Since ROIC (7.83%) is lower than industry benchmarks (~12-20%), RSKIA can improve its capital efficiency by focusing on profitability, asset utilization, and strategic investments. Here are some key areas for improvement:
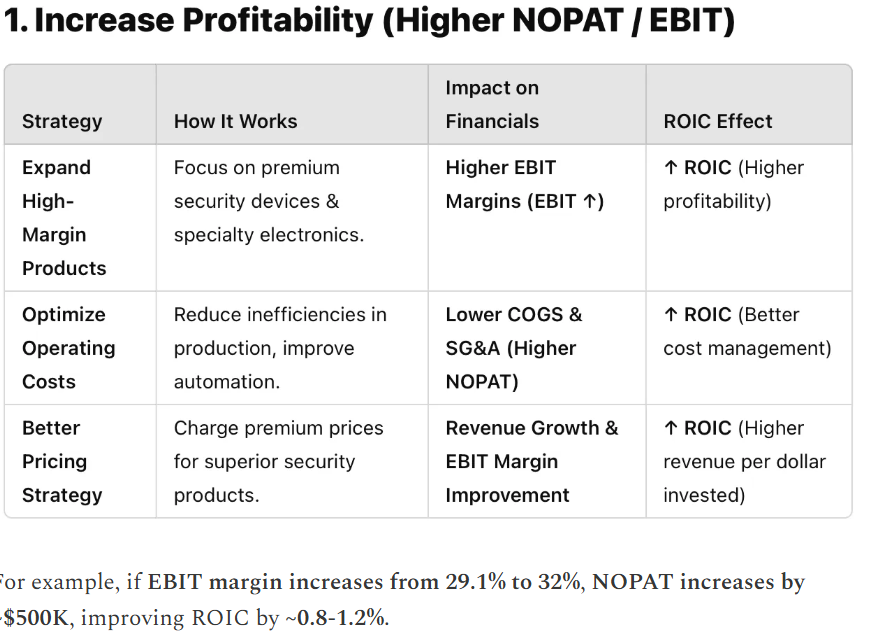
1. Increase Profitability (Higher NOPAT / EBIT)
Expand High-Margin Product Lines
- Focus on premium security devices & specialty electronic components where margins are higher.
- Move away from low-margin, commoditized products.
Improve Pricing Strategy
- Leverage brand strength & quality to command higher prices.
- Offer customized security solutions for high-value customers.
Optimize Operating Costs
- Reduce manufacturing inefficiencies & optimize supply chain management.
- Lower production costs without sacrificing quality.
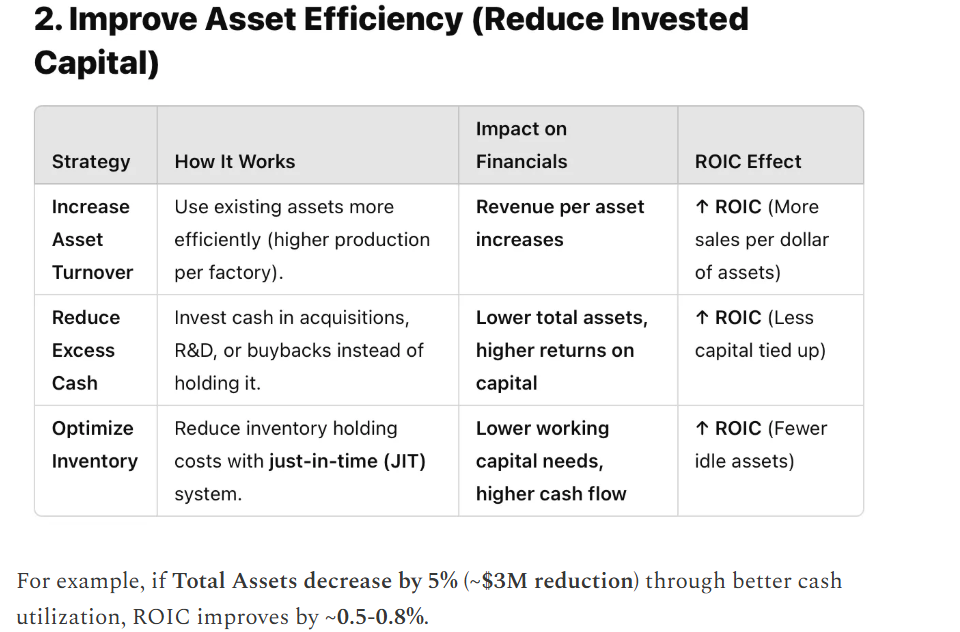
2. Improve Asset Efficiency (Reduce Invested Capital)
Increase Asset Turnover
- Make better use of existing factory capacity to produce more revenue per dollar of assets.
- Outsource non-core manufacturing to focus on high-value processes.
Reduce Excess Cash or Unused Assets
- RSKIA has zero debt, meaning it holds a lot of cash. If excess cash is not reinvested, it drags down ROIC.
- Use cash for acquisitions, R&D, or share buybacks to improve capital efficiency.
Optimize Inventory Management
- Avoid excessive inventory buildup, which ties up capital. One of the reasons for its inventory build-up could be rising inflation. Its receivables have also increased in recent years which warrants an aggressive collection policy.
- Implement just-in-time (JIT) inventory systems to reduce holding costs.
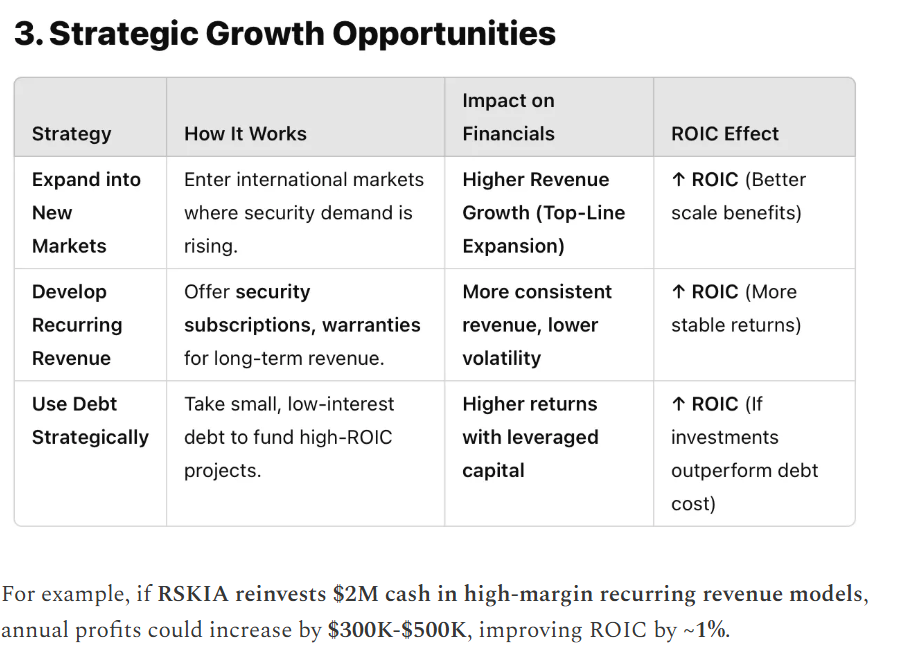
3. Leverage Strategic Growth Opportunities
Develop More Recurring Revenue Streams
- Offer subscription-based monitoring services for security products.
Use Debt Strategically
- While zero debt is safe, small, well-managed debt can boost returns if invested wisely.
- Borrowing at a low interest rate to invest in high-ROIC projects can increase efficiency. Although it has increased its asset base in recent years by investing in Solar equipment, buildings, and land, however, it did not have any material effect on its returns and subsequent earnings.
How Each Strategy Could Impact RSKIA’s ROIC & Financials
- To improve ROIC, RSKIA needs to increase profitability (higher NOPAT) or improve asset efficiency (lower invested capital). Below is a financial breakdown of how each strategy could impact key metrics.
Forecasting RSKIA’s Financial Performance & ROIC Improvement
- Now, we’ll project how RSKIA’s financials and ROIC could change over the next 5 years (2024-2028) if it implements the suggested strategies.
1. Key Assumptions for Forecasting
To estimate RSKIA’s financial performance, we will assume:
- Revenue Growth Rate
- Baseline: 5% per year (current trend).
- With Growth Strategies: 8-10% per year (from expansion & pricing improvements).
- EBIT Margin Improvement
- Baseline: ~29.1% (2023).
- With Cost Optimization & Pricing: 31-33% by 2028.
- Invested Capital Efficiency
- Baseline: Total Assets grow at 4% per year.
- With Asset Optimization: Lower cash holdings & inventory reduction improve efficiency.
- Now, we’ll calculate projected revenue, EBIT, NOPAT, and ROIC for the next 5 years.
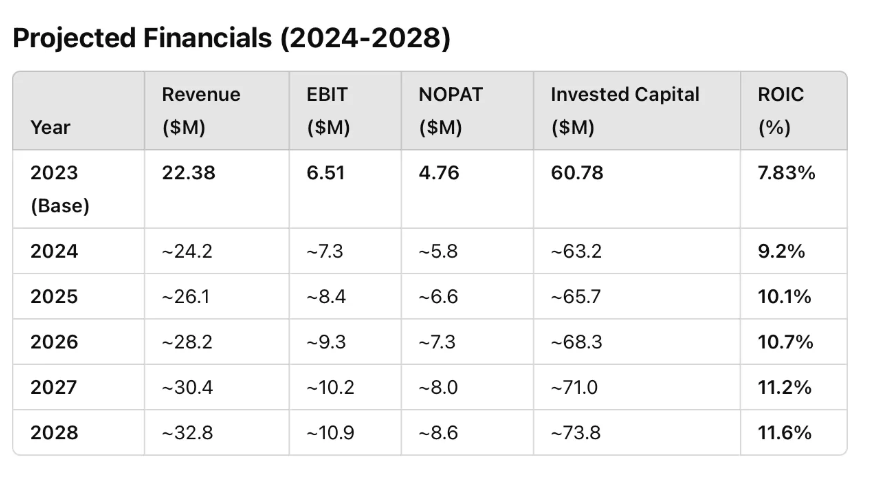
Key Insights
- Revenue Growth (~8-10% per year): Driven by better pricing, new markets, and recurring revenue models.
- EBIT Margin Improvement (29.1% → 32%): Through cost optimization and pricing adjustments.
- ROIC Growth (7.83% → 11.6%): This is due to higher profitability and better capital efficiency.
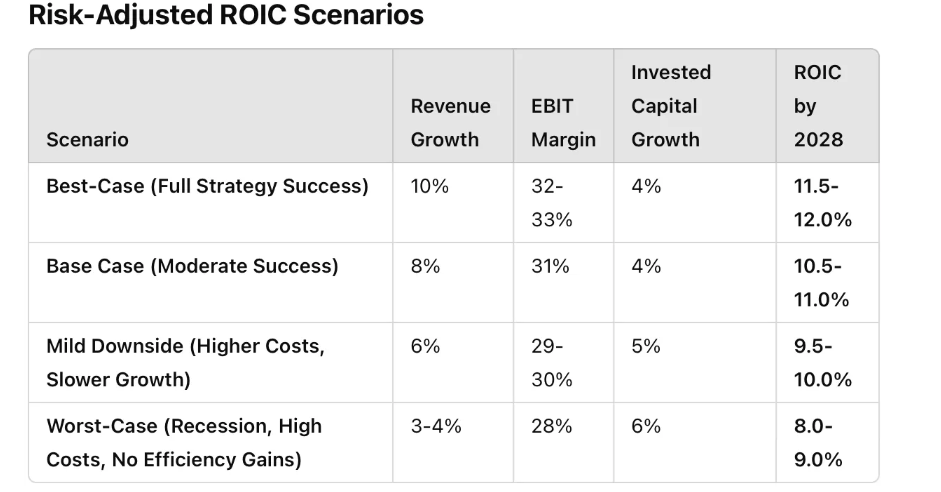
- Therefore, by implementing these strategies, RSKIA could achieve an ROIC of 11-12% by 2028, making it more competitive with industrial electronics and security peers (12-20%).
Key Risks
Risk Analysis for RSKIA’s ROIC Improvement Plan
While the forecast suggests RSKIA’s ROIC could rise from 7.83% (2023) to ~11-12% (2028), several risks could impact this outcome. Here’s a detailed risk breakdown:
1. Market & Revenue Growth Risks
Risk: Slower-than-expected demand for security products.
Impact: If revenue grows at only 4-5% instead of 8-10%, EBIT & ROIC improvements will be weaker.
Mitigation:
- Expand into new geographies (international security markets).
- Focus on recurring revenue models to stabilize cash flow.
Worst-Case Scenario: If revenue only grows 4% per year, ROIC may stay below 9-10% instead of reaching 11-12%.
2. Profitability Risks (EBIT Margin & Cost Control)
Risk: Higher material, labor, or supply chain costs.
Impact: If EBIT margin stays at ~29% instead of improving to 32%, ROIC could be 1-1.5% lower.
Mitigation:
- Secure long-term contracts with suppliers to stabilize costs.
- Automate production processes to reduce labor dependency.
- Pass cost increases to customers through smarter pricing.
Worst-Case Scenario: If the EBIT margin falls to 28% (instead of rising to 32%), ROIC may only reach 9-10%instead of 11-12%.
3. Asset Utilization & Capital Efficiency Risks
Risk: Excess cash & inefficient asset allocation.
Impact: If invested capital grows faster than revenue/EBIT, ROIC will decline.
Mitigation:
- Use cash for share buybacks, dividends, or acquisitions instead of holding it idle.
- Improve inventory turnover & supply chain management to avoid excess working capital.
Worst-case scenario: If invested capital grows faster than NOPAT (~6% per year instead of 4%), ROIC might not improve above 9-10%.
4. Competitive & Industry Risks
Risk: Stronger competition from bigger players (Honeywell, Allegion, TE Connectivity).
Impact: Market share loss → Lower revenue growth & margins.
Mitigation:
- Focus on differentiated, high-value security solutions rather than commodity products.
- Build strategic partnerships (e.g., smart home, IoT security firms).
Worst-case scenario: If competition forces price cuts, EBIT margin drops, and ROIC stays below 9%.
5. External Risks (Recession, Interest Rates, Inflation)
Risk: Economic downturn slows housing & security markets.
Impact: Lower sales growth & delayed commercial orders.
Mitigation:
- Shift towards B2B contracts (government, corporate security deals).
- Maintain a lean cost structure to handle downturns.
- Worst-case scenario: In a severe recession, revenue growth may drop to 2-3%, keeping ROIC near 8-9%.
Key Takeaways
Biggest ROIC risk: Slower revenue growth & rising costs.
Most important lever: Expanding high-margin products & improving efficiency.
Risk-Adjusted ROIC Expectation: 9-11% range, with 12% possible in a best-case scenario.
Other Business & Governance Risks
· Ownership Concentration: Bonita Risk (Director) controls 59.6% of shares, raising governance concerns.
· Limited Internal Controls: Identified material weaknesses in financial controls due to limited personnel (CEO also acting as CFO).
· Related Party Transactions: Past transactions include property leases and banking relationships with director-linked entities. $6.89M in FirsTier Bank (director-linked)
· Revenue Concentration:
40% of sales stem from a single distributor.
85% of revenue is derived from security switches.
· Declining Sales: Q2 2024 sales fell 7.27% year-over-year due to weaker demand and supply chain issues.
· Higher Operating Expenses: Increased sales commissions and wages impacted profitability.
· Investment Portfolio Dependency: ~50% of earnings are linked to market-dependent securities.
. Market Volatility: Equity portfolio ($27.98M) is exposed to stock market swings.
. Interest Rate Sensitivity: Municipal bonds may face further losses if rates rise.
. Concentration: 77% of investments in equities (higher risk vs. fixed income).
Financial Risks
· Uninsured Cash Holdings: $6.8M held in a single uninsured bank (FirsTier Bank).
· Inventory Obsolescence: Allowance of $408K as of October 2024.
Risks to Monitor
· Market fluctuations impacting the investment portfolio.
· Customer concentration and governance practices.
Estimating RSKIA’s Annual Return (Total Shareholder Return) Over the Medium to Long Term
To estimate RSKIA’s annual return, we need to consider:
- Stock Price Growth (Capital Appreciation)
- Dividend Yield (Cash Returns to Investors)
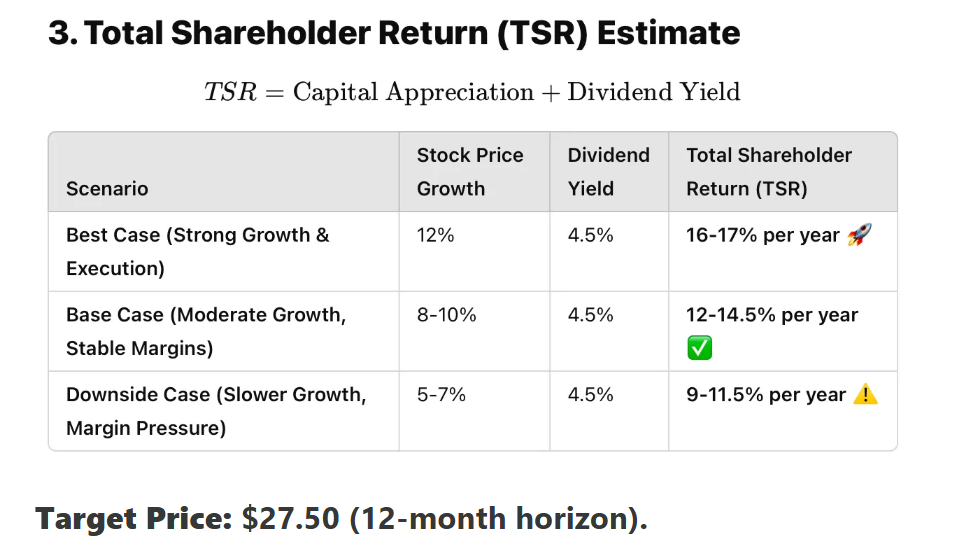
- Total Shareholder Return (TSR) = Capital Appreciation + Dividends
1. Capital Appreciation (Stock Price Growth Projection)
Stock Price Growth Depends on EPS Growth & Market Valuation (P/E Ratio)
- EPS Growth Estimate:
- If RSKIA grows earnings at 8-10% per year, the stock price should grow at a similar rate, assuming the valuation remains stable.
- P/E Ratio Consideration:
- The current P/E multiple should remain steady unless market sentiment changes.
Projected Stock Price Growth:
- Base Case: 8-10% per year
- Best Case (High ROIC Execution): 12% per year
- Downside Case (Slower Growth): 5-7% per year
2. Dividend Yield & Dividend Growth
RSKIA Pays Dividends, Enhancing Returns
- Current Dividend Yield: ~4.5% (based on historical payouts).
- Dividend Growth Rate: Likely ~4-6% per year if earnings grow steadily.
Projected Dividends Contribution to Returns:
- Base Case: 4.5% dividend yield + ~5% dividend growth
- Best Case: 4.5% yield + 6-8% growth
- Downside Case: 4.5% yield + minimal growth
Conclusion
For investors seeking stable dividends and long-term growth, George Risk Industries presents a compelling, low-risk investment opportunity. RSKIA acts as a “hidden bank account,” but over-reliance on market-driven income and ownership concentration warrant caution. Therefore, short-term investors should closely monitor sales trends before investing.
RSKIA remains a cash-rich, underfollowed small-cap with hidden assets and an attractive dividend yield. While some risks exist, the margin of safety and intrinsic value upside support a Buy rating. Long-term investors could see ~3x-4x returns over 10-12 years if RSKIA executes well. As a base case, investors could Expect 12-14% annual return (stock price + dividends) over the long term.
Disclaimer
This report is for informational purposes only and does not constitute financial advice. RSKIA’s financial data used in this analysis is based on SEC filings and publicly available financial reports. Investors should conduct their own due diligence and consult with a qualified financial advisor before making any investment decisions.
It is important to note that we as Moods Investments or Moods Investment Research or the analyst of this report do not hold any investments in George Risk Industries (RSKIA) or any other securities mentioned in this report. Furthermore, we do not intend to initiate one within the next 72 hours. Therefore, we are not responsible for any losses resulting from reliance on the information provided in this report.
This disclaimer ensures transparency and clarifies that the analysis and recommendations provided are unbiased and not influenced by any personal financial interests or intentions. The analysis is based on publicly available information and should not be considered financial advice.
Investment Risks:
Market Risk: Security values may fluctuate due to market conditions, economic factors, and investor sentiment.
Company-Specific Risk: Operational and strategic decisions may impact stock performance and dividends.
Small-Cap Volatility: RSKIA may exhibit higher price volatility and lower liquidity compared to larger firms.
Revenue Concentration Risk: Heavy dependence on a single distributor and security switch sales.
Governance Risks: Concentrated ownership and limited internal controls.
Investment Dependency: Reliance on investment income ties earnings to market conditions.