
By Maha Farooq– Equity Analyst
Investment Thesis
Tesla Inc (TSLA) represents a unique hybrid between automotive manufacturing, clean-energy provider and emerging AI technology platforms. The company’s vertically integrated business model, global charging infrastructure and leadership in battery technology provides durable competitive advantages that are difficult for traditional automakers to replicate. Additionally, the company’s rapidly scaling in energy generation and storage segments adds diversification and long-term margin expansion potential, while Robotaxi ambition and self-full driving, Optimus robotics and Dojo AI computing position Tesla for software-like recurring revenues over the long term.
Despite being a high growth company, and because of extremely high capex Tesla’s DFCF based valuation suggests a fair value of $79 per share suggesting that the stock is trading far above its fair value at $481. While falling interest rates, expanding energy storage deployments and AI-driven optionality serve as powerful long-term catalysts, its near-term profitability remains pressured by intense competition, high capital requirement, price cuts and slowing vehicle demand. Therefore, the company offers compelling long-term strategic optionality with limited margin of safety at its current price.
Tesla currently is not receiving major subsidies directly from the government of U.S but the situation is nuanced under the Trump administration. There is no immediate executive order that specifically cuts all subsidies to Tesla. However, EV-related government support has been reduced and rolled back in stages. The most important changes are that the U.S federal EV tax credit up to $7,500 which benefited Tesla buyers supported sales has ended in September 2025 indicating the company no longer benefits from this key federal initiative.
Company Overview
Tesla is a leading global technology and energy company. It designs, develops, manufactures sells and leases high performance fully electric vehicles as well as storage systems and energy generation. Additionally, the company’s operations include a wide range of customer focused services such as charging infrastructure, vehicle servicing and financial solutions that support its product ownership.
To widespread EV adoption the company has built a global customer facing ecosystem including.
- Body shops
- Vehicles showrooms
- Supercharger stations
- Destination charges
- Service centers and mobile service
The company places strong emphasis on safety, performance, attractive design as well as user experience. Tesla continues to develop full self-driving technology focused at improving safety as well as enhancing long-term product value. Despite these efforts the company prioritizes reduction of total cost of ownership through manufacturing efficiency as well as tailored financing options.
Tesla’s overarching mission is to accelerate the world’s transition to sustainable energy. Its technological leadership, vertically integrated structure as well as seamless customer experience differentiates the company from traditional automotive and energy companies.
Business Model
Tesla operates a vertically integrated business model controlling everything from product design as well as engineering to manufacture, sales. Such integration allows the company to innovate rapidly, reduce cost, and deliver a unified customer experience.
Its business model includes selling direct to customers, bypassing traditional dealerships. Despite this it ensures transparent pricing, better brand control as well as tighter customer relationship. Additionally, the company designs and builds major components in-house including powertrains, batteries and software, reducing dependency on suppliers and lowering the production costs over time. Alongside vehicles the company produces energy storage such as Megapack and Powerwall as well as solar generation system creating an integrated clean energy ecosystem for homes, utilities and businesses.
Tesla is heavily investing in its proprietary infrastructure, Supercharger network for fast charging as well as destination charges for convenient charging locations, mobile services, service center and body shops for repairs.
Tesla continues to develop its full self-driving software aiming to improve safety and introduce long term revenue stream through continued software upgrades and subscriptions.
The company aggressively focuses on lowering manufacturing as well as operating cost to enhance affordability. It also provides various financing, leasing and insurance services tailored to its products.
Tesla operates two main core segments:
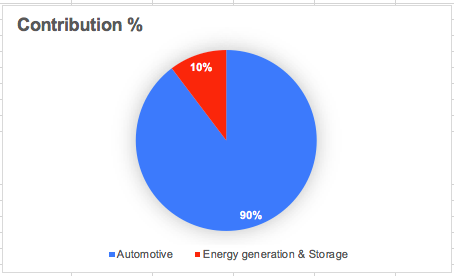
Automotive Segment: This segment is Tesla’s core business it contributed approximately 89.7% in total revenue as of 2024. This segment includes designing, manufacturing as well as sale of electric vehicles. It covers all models (Model S, 3, X, Y and Cybertruck), along with the development of autonomous driving technologies such as full self-driving and autopilot. The segment also includes leasing of vehicles, sales of regulatory credits and software features that consumers purchase to enhance vehicle capability. This segment also includes services and other, it provides support services related to company’s products. It covers supercharger network revenue, vehicle servicing, charging services, used vehicle sales, insurance and branded merchandise. Despite these products and services this segment generates revenue from body shop operations, spare parts and software services not directly tied to sale of the vehicles.
Revenue generated from this segment in Q3 2025 was $21.2 billion an increase of 6% YoY from $20 billion in Q3 2024. Revenue from services and other increased from $2.7 billion in Q3 2024 to $3.4 billion in Q3 2025(TTM) an increase of 25% YoY.
Source: Moods Investment Research
Energy Generation and Storage: This segment contributed approximately 10.3% in total revenue in 2024. It designs, manufactures as well as installs clean energy products for businesses, utilities and homes. It includes megapack (utility scale batteries), Powerwall (home storage), Solar Roof and traditional solar system.
This segment focuses on offering modular, easy to install system that lower installation time and cost. Additionally, Tesla sells these products through its stores, website galleries and third-party partners. It works with thousands of certified third-party installers worldwide such as roofing companies, electricians, solar installers.
It also provides options like power purchase agreements for commercial clients. Tesla now heavily relies on these partners and does not disclose an exact percentage spent on each one of them. But most of the new energy installations are done through third-party installers such as Samsung SDI, Eve Energy, and CATL rather than the company’s own team.
The company supports customers with warranties, repairs, installation services and financing options. Tesla aims to simplify and standardize clean energy adoption to reduce customer acquisition cost while expanding renewable energy globally. This segment contributed $3.4 billion in Q3 2025(TTM) an increase of 44% YoY from $2.3 billion in Q3 2024.
Due to recent launch of new lease offering in the U.S. for solar and Powerwall that provides customers with predictable cost with attractive features, including a lower monthly payment compared to loans.
Financial Analysis
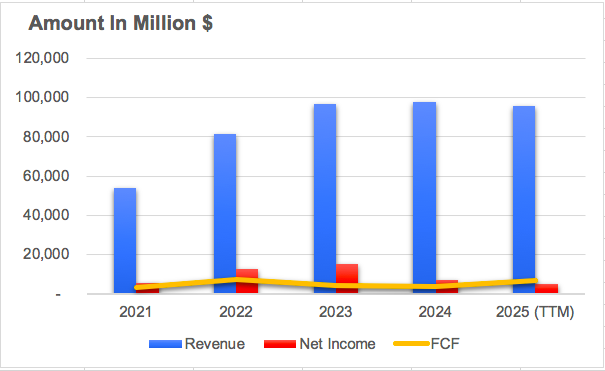
Tesla’s revenue indicated strong growth since 2021 through to 2024 however slightly easing in 2025 (TTM). The revenue increased from $53.8 billion in 2021 to $97.6 billion in 2024 and $95.6 billion in 2025(TTM). However, during the entire period Tesla’s cost of revenue remained high which increased from $20.2 billion in 2021 to $79.3 billion in 2025(TTM) primarily due to increased manufacturing costs, rising raw material expenses due to tariffs and aggressive price reductions on core vehicle models due to competition pressure. These factors pressured margins however, the overall revenue stayed at historically elevated levels.
Source: Moods Investment Research
The company’s net income showed fluctuation between 2021-2025(TTM). Its profit climbed from $5.6 billion in 2021 to a peak of $15 billion in 2023 indicating strong deliveries, improved cost efficiency as well as margin expansion during those growth years. However, after 2023 net income dropped significantly falling to $7.15 billion in 2024 as well as
declined further to $5.14 billion in 2025 (TTM). The decline suggests substantial margin pressure driven by price cut across major vehicle models, higher production, operating costs and slower demand growth.
Tesla’s free cash flow has fluctuated significantly from 2021 to 2025 (TTM) indicating changing demand condition due to high competition from companies like BYD. FCF rose from $3.48 billion in 2021 to $7.55 billion in 2022 driven by high deliveries but sharply declined to $4.36 billion in 2023 as price cuts and cost pressure began to affect cash generation. The weakness continued into 2024 with free cash flow declining to $3.58 billion
but it rose in 2025 (TTM) to $6.83 billion due to reduced capital expenditure as well as stabilization in operating cash flows.
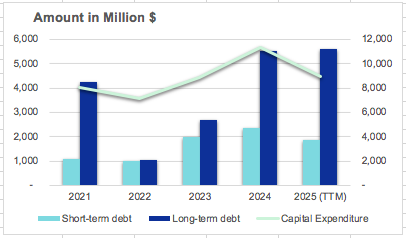
The company’s total debt fluctuated between 2021-2025(TTM) rather than steady upward trend with its total debt declining sharply in 2022 from $8.8 billion in 2021 to $5.7 billion in 2022. However, it peaked at $13.6 billion in 2024 due to higher borrowing to fund capital expenditure as well as strategic investments in 2025(TTM) with its total debt reduced to $7.6 billion indicating repayment of obligations as well as improved balance sheet discipline.
Source: Moods Investment Research
Capital Expenditure
The company’s capital expenditure has been uneven between 2021-2025(TTM) indicating a shift in factory expansion, investments in battery production, and energy-storage scale-up. Capex rose from $8 billion in 2021 to $11.3 billion in 2024 and $8.9 billion in 2025(TTM). Tesla has invested in Global expansion capacity, Berlin ramp-up 4680 battery development and Gigafactory Texas.
Competitive Analysis
Metrics FY2025 (TTM) | Tesla | BYD |
| Market Cap | $1.44 T | $121.29 B |
| ROE% | 6.78 | 18.13 |
| ROA % | 4.04 | 4.61 |
| ROIC % | 4.89 | 7.22 |
| P/E Ratio | 305.97 | 22.47 |
| Debt-to-equity | 0.17 | 0.4 |
| Debt-to-assets | 0.1 | 0.11 |
| EPS | 1.5 | 0.6 |
| FCF margin % | 7.15 | -3.03 |
| Dividend per share | – | 0.18 |
Note: For BYD the amount has been converted to US$
The competitive analysis of Tesla and BYD clearly indicate a contrast between profitability, valuation as well as financial strategy. Tesla has a significantly larger market capitalization compared to BYD reflecting strong shareholders expectation for long-term growth. However, this optimism is also evident in Tesla’s extremely high P/E ratio of 305.97 indicating the stock is richly valued by the market related to its current earnings. BYD’s P/E ratio of 22.47 appears to be more reasonable and suggests better alignment between price and earnings. From profitability standpoint, BYD outperforms Tesla with higher ROE, ROA as well as ROIC signaling more efficient use of equity, assets and invested capital. However, on the other hand Tesla maintains a stronger balance sheet with lower leverage as seen in its debt-to-equity of 0.17 compared to 0.40 for BYD. Tesla records a positive free cash flow margin in 2025(TTM) while BYD’s negative free cash flow margin of (-3.03%) suggests reinvestments or cash outflows despite BYD offering a dividend of 0.18 per share compared to Tesla’s zero dividend policy.
DFCF Based Valuation
Based on Tesla’s FCF growth for the last 5 years the company seems to be overvalued at its current market price of $481 per share. As the interest rates are expected to come further down yet we apply a conservative discount rate of 6% considering the risks in EV industry, its fair value based on the future FCF growth is estimated to be $79 per share.
Therefore, at its current market value, Tesla appears to be extremely overvalued with a “HOLD” rating to fully capitalize its future growth potential.
EBIT based Sum-of-the-parts (SOTP) Valuation of TESLA
Since TESLA has two major operating segments under its umbrella it is worth evaluating them independently based on their own contributions of EBIT. It necessitates that we conduct an SOTP valuation using an industry average multiple of 20x.
Segments | EBIT (Amount in Million) | Multiple | Valuation(Amount in Million) |
Automotive | $8,378 | 20 | $167,560 |
| Energy generation & storage | $962 | 20 | $19,240 |
| Fair Value = Total SOTP / No of shares Outstanding diluted | $186,800 / 3,498= $53.4 per share |
As we can see using SOTP valuation based on EBIT, gives an implied fair value of $53.4 per share which is significantly below its current market price, indicating that company’s current stock is priced for its aggressive growth as well as margin expansion expectations which are not materialized yet in its current operating earnings.
FCF Based SOTP
Segments | FCF (Amount in Million) | Multiple | Valuation (Amount in Million) |
Automotive | $3,212 | 20 | $64,240 |
Energy generation & storage | $369 | 20 | $7,380 |
| Fair value = Total SOTP / No of shares outstanding diluted | $71,620 / 3,498 = $20.47 per share |
Tesla’s FCF based SOTP valuation also gives an implied fair value of $20.47 per share which is significantly below its current price.
Catalyst Driving Tesla
Key catalyst driving Tesla are centered on long-term growth expectations rather than near-term profitability. Strong deliveries of vehicles and continued revenue growth indicate that demand remains resilient. While energy generate and storage segment is scaling rapidly and contributing higher margin diversification beyond Automotive sales. Management is focusing on Full-self driving and Robotaxi ambition. Moreover, the company continues to use AI capabilities as a major valuation driver. Additionally, the company is progressing in AI, Dojo computing and Optimus robotics project reinforces the company’s positioning as a technology and AI company rather than just an EV manufacturer. These factors support investors optimism as well as justify the company’s premium valuation despite margin pressure and competitive challenges in the core EV business. Moreover, Tesla continues to deploy significant capital expenditure towards new factories, product line upgrades, energy storage capacity and battery technology. These factors support volume growth and lowers unit costs overtime, despite putting short term pressure on its FCF. While these investments haven’t yet translated into immediate earnings uplift, yet they are expected to generate high operating leverage and recurring software revenues in long term particularly Robotaxi and autonomy services.
Declining interest rates is a positive sign and will serve as a catalyst for the company improving affordability. It will stimulate demand for its products as lower interest rates reduce the cost of auto loans and leasing thus making the company’s vehicles more accessible to consumers and supporting higher delivery volumes. Additionally, declining of interest rates also lower Tesla’s cost of capital which is super important given its capital-intensive business model and ongoing investments.
Key Risks Faced by Tesla
The company faces a wide range of operational, financial, strategic and regulatory risks that could materially impact its core operation and long-term performance. Demand for its products is sensitive to volatility in energy prices, sudden rise in interest rate and cyclical automotive market, while global macroeconomics uncertainty can further suppress customer spending as well as increase earnings volatility. Tesla operates in a competitive environment from different regions, especially China with both established automakers and new entrants intensifying competitive environment. Most established automaker as well as new entrants are intensifying competition in electronic vehicles, energy storage and autonomous driving technology that potentially leads to price pressure and margin compression. Additionally, the company is exposed to financial risks such as currency fluctuation, consumer credit exposure, financing risks, high capital requirement, debt covenant constraints as well as reliance on continued access to capital market. The company is highly dependent on Elon Musk for its strategic vision, public credibility and leadership. Therefore, any negative market perception surrounding his actions and distraction due to his commitments to other ventures, whether political or otherwise could significantly undermine shareholder confidence and operational execution.
Moreover, capital expenditure represents a significant risk for the company due to its business model being highly capital-intensive and its dependence on continuous large-scale investments in Gigafactories, charging infrastructure, battery technology and new vehicle as well as energy products. These investments require substantial upfront cashflows with returns that are uncertain which is highly sensitive to demand forecasts, regulatory developments and technology changes.
The Trump administration has openly threatened to review and reduce additional subsidies as well as clean programs linked to Elon Musk’s companies and has suspended funding for EV and initiatives. Though some actions are still facing legal and legislative challenges. Internationally Canada has already frozen EV rebate payments to Tesla and excluded it from future rebate programs.
Conclusion
Tesla remains one of the most innovative and strategically differentiated company in the global EV as well as clean energy landscape supported by technological leadership, strong brand eco-system and vertical integration. Tesla’s long-term vision in autonomy, AI, energy storage and robotics continues to justify shareholders optimism and positions the company beyond a traditional automaker. However, financial performance since 2023 indicate rising competition pressure, margin compression as well as high capital intensity is undermining the company. The valuation outcomes from DFCF and SOTP analysis suggest that Tesla’s market price significantly exceeds its fundamental values at this time. However, Tesla being a high growth company remains strategically attractive for long-term investors seeking an exposure to AI, EV and clean energy to benefit from its long-term growth.
Disclaimer
The information provided by Moods Investment Research is for general informational and educational purposes only. It is not intended as, and does not constitute, financial, investment, tax, legal, or other advice. The content is not a solicitation or recommendation to buy, sell, or hold any securities or investment strategies.
All opinions expressed are based on current analysis and are subject to change without notice. While we strive for accuracy, Moods Investment Research
makes no representation or warranty as to the completeness, accuracy, or reliability of any information provided. Investing involves risk, including the possible loss of principal. Past performance is not indicative of future results. You should conduct your own research and consult with a qualified financial advisor before making any investment decisions.
Moods Investment Research and its founders, directors, or affiliates are not liable for any losses or damages arising from any reliance on the information provided.
The views expressed in this article are those of the author(s) and do not constitute investment advice. The author does not hold a position in Herbalife. However, the author(s), including any editors or contributors (collectively referred to as “Moods and directors”), may or may not hold positions in other securities mentioned. Any such holdings are subject to change without notice.
Artificial intelligence (AI) technologies were used to support data processing, drafting, and/or analysis in this report. All conclusions and recommendations reflect the author’s independent judgment. While care has been taken to verify all information, neither the AI tools nor the authors guarantee accuracy or completeness. Therefore, whilst results derived from AI were reviewed for reliability; however, users should independently verify critical information.
wish you best and best