
Investment thesis
VF Corporation (VFC) presents a long-term value opportunity driven by its diversified brand portfolio including iconic brands such as The North Face, Timberland, Vans. Despite recent challenges, VFC has taken strong corrective measures through its Reinvest program, mainly focusing on brand revitalization, cost efficiency as well as repair of balance sheet. A $1.6 billion reduction in debt, coupled with improved operating discipline and leadership alignment demonstrates management’s commitment to restoring profitability.
The recovery of the Vans segment remains the key issue which is now supported by strategic investment in design, digital expansion as well as marketing. VFC’s other top brands like Timberland and The North Face continue to deliver solid margins because of brand strength. According to our estimate VFC has a fair value of $17 per share based on the industry average FCF multiple applied to its SOTP valuation. Therefore, the stock trading close to its fair value at $14 has very limited upside potential of 20% in the short term.

Source: Company Website
Company overview
VF Corporation is a leading global apparel and footwear company, founded in 1899 and headquartered in the United States. The company is operating a diversified portfolio of Outdoor, Active and Workwear brands. It operates iconic brands The North Face, Timberland, Vans, and Dickies. The company is well recognized for quality, combining performance and innovative design. VFC is dedicated to deliver long-term value to its shareholders, customers, employees as well as communities.
The company emphasizes sustainability, design excellence and innovation across its product line. Its commitment to sustainable practices includes enhancing the lifecycle of its products and promoting responsible sourcing and supporting societies in which its segments operate.
Business model
VF Corporation’s business model is built on a foundation of global reach, multi-channel distribution and brand diversification allowing the company to balance risk while pursuing growth opportunities across multiple markets.
VFC operates as a portfolio of lifestyle brands in the footwear, apparel, as well as accessories sectors with iconic brands. Brand diversity enables the company to serve a wide range of customer segments from outdoor and workwear, enthusiasts to youth and fashion driven consumers.
By reducing dependency on any single product or demographic group, the company’s revenue is generated mainly through two primary channels:
- Wholesale distributor: It places products in specialty stores, mass merchants, department store and independent retail partners. Wholesale revenue was 56% of the company’s total revenue in 2025 compared to 55% in 2024 thus an increase of a meagre 1%.
- Direct-to-consumer operations: It includes VFC-operated stores, concession retail stores, brand e-commerce platforms and other digital sales channels. In 2025 approximately 44% of the company’s revenues were generated through this channel indicating company’s strong digital as well as retail presence. Direct to customer revenue declined from 45% in 2024 to 44% in 2025.
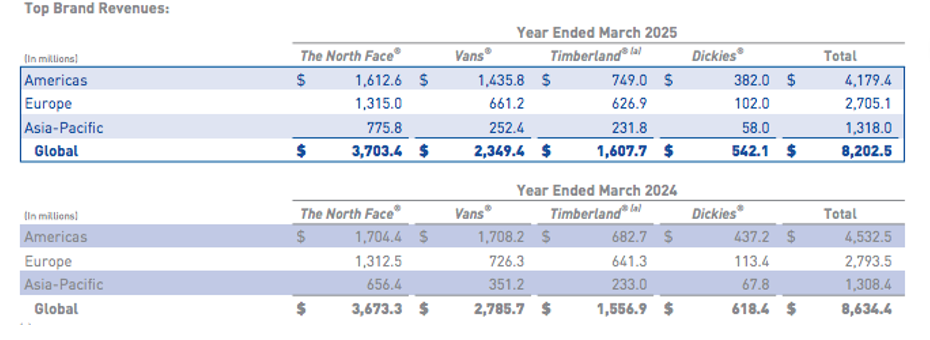
Geographically VFC has maintained a balanced global footprint, approximately 51% of its total revenue coming from Americas as well as 34% from Europe and 14% from Asia-Pacific region. The global diversification helped VFC mitigate regional economic fluctuation.
VF Corporation operates three main core segments
- Outdoor: This segment includes brands like The North Face, Timberland, Altra, Smartwool, Icebreaker, this segment includes brands focused on outdoor performance, footwear and apparel.
Source: VFC’s 2025 Annual Report (10K)
VFC’s Global revenues from its Outdoor segment increased 1% in 2025 compared to 2024. This slight increase was due to strong rise in the Asia-Pacific region especially in greater China by 14% while Europe remained flat and the Americas declined by 2%.
The North Face brand also grew 1% globally supported by gains in Asia-Pacific offsetting weakness in Americas. Timberland rose 3% overall, driven by double digit growth in the Americas but it slightly declined in other regions, however direct-to-consumers sales increased 6% indicating strong brand momentum, and wholesale revenues fell by 2% due to less demand in key markets.
- Active: This segment mainly focuses on activity-based lifestyle, streetwear and youth culture brands this segment includes brands like Vans, Eastpak, JanSport, Kipling and Napapijri etc.
Source: VFC’s Annual Report (10K)
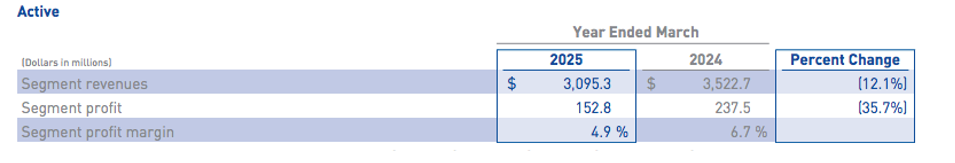
VFC’s Active segment continues to face challenges and had a sharp decline in 2025 with global revenue down by 12% including unfavorable currency impact. Asia-Pacific dropped 23% and Americas fell 13% as well as the Europe declined by 7%.
Its largest brand Vans’ revenue declined by 16% driven by lower demand and VFC’s strategic restructuring efforts such as reducing wholesale storefronts. Direct-to-consumers sales declined 20% while wholesale revenues fell 3%.
- Work: This segment is mainly work-inspired focused, workwear lifestyle apparel and footwear safety. This segment includes Dickies and Timberland PRO.
Source: VFC’s Annual Report (10K)
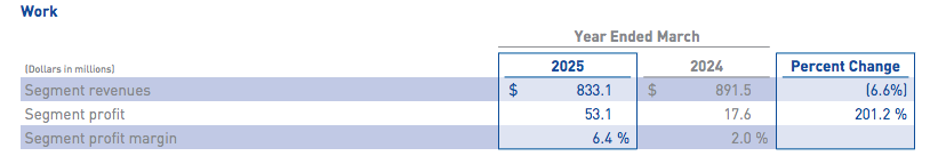
Globally the revenue from this segment declined by 7% in 2025 as compared to 2024. Regionally revenue fell 5% in the Americas while 10% in Europe and 14% in Asia-Pacific.
Dickies brand that drives this segment’s most sale recorded a 12% global decline.
The decline in Americas indicate reduced inventory replenishment and less demand from key U.S wholesale customers.
Despite lower sales in the work segment (Dickies and Timberland Pro), profit margins improved year over year supported by higher gross margins. This segment faced pressure across all regions but benefited from more efficient inventory controls. They reduced inventory level by clearing out older or off trend products via discount or liquidation. The company also produced only what retails and the consumers want. It announced the sale of Dickies brand in their latest Q2 earnings release potentially for $600 million. The main reason for this sale given in its quarterly report is to reduce the debt.
Dickies contributed approximately 6% to VFC’s revenue in 2025. The company acquired Dickies in 2017 for $820 million so the $600 million sales price represents a loss of approximately 25% of the original investment made thus reflecting poor capital allocations by the previous management. Despite this loss the management views the transaction as strategically attractive given Dickies’ persistent underperformance and the opportunity to redeploy capital elsewhere to increase shareholder value in the long term. The sale of Dickies is part of the “Reinvest” turnaround program launched in 2023.
Financial and operational strengths
The company showed strategic progress in 2025 marked by improvements in cost, leadership alignment and improvements in leverage. These steps are reinforcing VFC’s foundation for long-term growth and its profitability.
- Strengthening balance sheet
The company reduced its net debt by 26% in 2025 compared to last year by paying down two major debt tranches totaling $1.8 billion. This effort brought the company’s leverage ratio down to 4.1x and this significant reduction improves the financial stability as well as improves the flexibility for future investments. By reducing debt, the company has improved its balance sheet health and strengthening the shareholders confidence.
- Optimized operational model
The establishment of the Americas regional platform enhanced organizational efficiency, an improvement in decision making, speed and accountability. VFC’s new business model includes operating through regional platforms starting with Americas distribution, market decision as well as inventory management which is handled regionally. The new structure helped the company better align resources with consumer demand, strengthen execution in one of its largest markets as well as responding quickly to shifts in customer demand and market trends.
- Vans Turnaround in progress
Major focus in 2025 has been the turnaround of the Vans brand facing sales pressure in the last few years. The company rebuilt Vans leadership team bringing in products and industry experts to restore brand momentum and innovation. VFC also rationalized its distribution channels to focus on profitability and quality partnerships. The brand is shifting from heavy reliance on wholesale channels to investing in its own stores as well as online platforms to drive sales. Vans aims to enhance its digital presence with better e-commerce experiences, targeted marketing on social media. The company plan to release exclusive, special edition shoes in small quantities for a short period thus creating excitement and sense of urgency among the young consumers. The plan also includes introducing new collection, reconnecting through music, stakes and streetwear communities to restore its cultural relevance.
Furthermore, VFC is tightening inventory control, thus focusing on higher-margin sales to return Vans to sustainable growth. The company is committed to turn around Vans by hiring “Sun” Choe as global brand president since July 2024. She previously led product and merchandising strategies in lululemon corporation. Vans contribute approximately 24.7% of VFC’s total revenues. Although the company has not set a specific revenue growth target for Vans but its overall plan aims to achieve $500-$600 million in operating income expansion and reach 10% operating margin by 2028 with Vans turnaround being central to that strategy.
Financial analysis
Declining revenue and net income
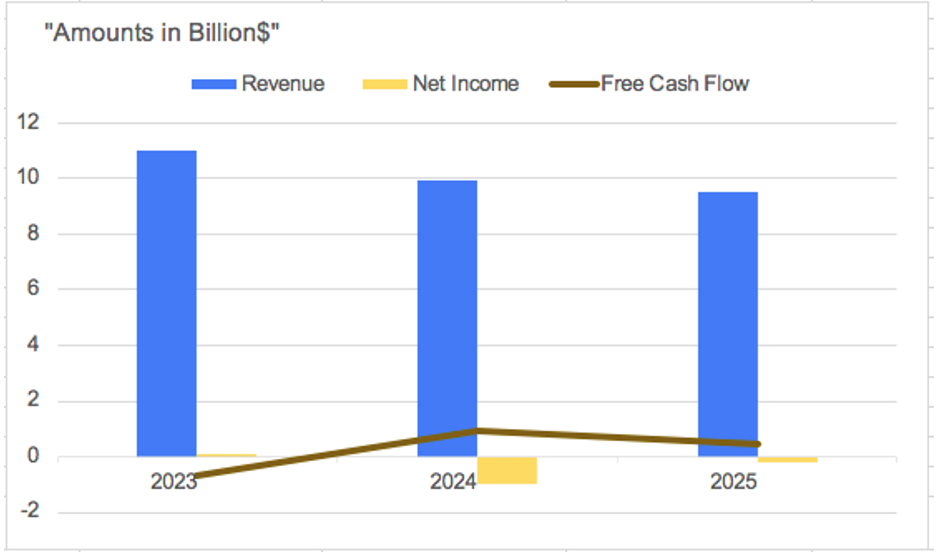
VFC’s revenue declined from $11.09 billion in 2023 to $9.50 billion in 2025 and $2.8 billion in Q2 2026 business cycle. Most of this decline was driven by Active segment while Outdoor segment stayed relatively stable. The company’s net income collapsed in 2024 mainly due to impairment charges and weak results from Vans brand. However, starting 2025 the loss from Vans has narrowed at a negative $190 million vs a negative $969 million and in 2024 indicating a modest improvement driven by outdoor profit recovery and cost control.
Source: Moods Investment Research
The chart above clearly indicates that VFC’s FCF has been hit badly by Covid-19 in 2023. Subsequently in 2024 for the first time the company reported a loss mainly attributed to a sharp drop in sale of Active segment, and other heavy impairment charges relating to supreme brand. The company recorded $735 million in non-cash goodwill and intangible asset impairment for supreme indicating bad investments leading to weaker growth and poor performance. However, in 2025 the company has reduced its loss indicating early sign of recovery and progress hence indicating effectiveness of its turnaround plan.
Free Cash flow and debt analysis
VFC’s Free Cash Flow increased from a negative $901 million in 2023 to a positive $339 million this year. The company continues to invest in its restructuring program which weighed on its free cash flows. A significant increase in its cash position actually came from the sale of its Supreme brand for $1.5 billion. The company used this amount to reduce its debt.
Therefore, the debt for the company decreased to $5.68 billion in 2025 from $7.34 in 2023 reflecting a reduction of $1.6 billion. Therefore, it’s a positive sign indicating leverage improvement. Its net debt-to-capital is reduced from 80% to 77% reflecting a positive change in the balance sheet.
VFC’s iconic brands remain most profitable that offset any steep decline in its non performing segments such as Active. The positive free cash flow is helping the company focus on reviving its Vans brand and reigniting growth.
Catalysts driving VFC’s future growth
- Reinvest program
VF Corporation launched its reinvestment program in 2023 to regain its profits, and position the company for long-term growth by strengthening its balance sheet. The program mainly focuses on improving the brand performance especially Vans by modernizing operation and cutting costs. Between 2024 and 2025 the company heavily spent on restructuring including severance and impairment charges of nearly $200 million. However, it also saved $300 million in costs. VFC also sold its non-core assets including supreme using the proceeds to pay down its growing debt. It’s expected to maintain its dividend and share repurchases are expected to restart at some point in near future once the investments made in Vans start producing results. Although the company still holds a $2.4 billion buyback authorization, however, it has suspended the repurchases to prioritize its reinvestment and deleveraging plans.
In addition, massive capital expenditures have been scaled back with the management now channeling resources more on low-cost design innovation, marketing, digital capabilities to improve its future sale and margin recovery. The reinvest program marks a shift from shareholder payouts to investments in operation aiming to rebuild equity and restore growth after losses in the last two years. Therefore, capital expenditure is reduced from $245 million in 2023 to $126 million in 2025 reflecting a positive move and a positive sign for its shareholders in terms of long-term value creation.
- Focus on margin improvement and shareholder returns
VFC has publicly disclosed in its annual report, its medium to long term target plan which includes returning substantial cash to shareholders after improving its operating margins. The main catalyst for growth could be the revival of its brand specifically Vans which has been a drag on the overall performance in terms of its margins. The company’s management has identified brand revitalization as a top priority, investing in product innovation, global distribution to reignite customer demand and marketing of this particular brand. Its other iconic brands such as Timberland and The North Face continue to benefit from strong outdoor and lifestyle trends thus supporting its strategy since these segments contribute higher margins and profits.
In addition, the main driver of this growth is management’s discipline and commitment to balance sheet repair. VFC continues its efforts to bring down debt and maintain consistent dividend payments that appeal to income seeking investors.
The convergence of operational improvements, brand recovery and financial discipline form the basis for the company’s path to achieving a fair value above its current price.
If the management executes its strategy carrying all these out initiatives successfully with the progress reflecting positively in its quarterly earnings it will help the company rebuild its credibility and reputation in the market and boost investor and shareholder confidence.
Moreover, the recent decline in interest rates is encouraging and can also act as a catalyst for the company’s growth. The cost on its debt and future borrowing is expected to be lower thus easing some financial pressure. Additionally, lower rates usually stimulate consumer borrowing and spending which should benefit the company’s core brands like Timberland and The North Face.
Competitor Analysis (2025 TTM)
| Metric | VFC | Columbia | Converse | Dr. Martens |
| Market Cap | $6.048B | $2.718B | $3.58B | $834.4M |
| ROE | -12.06% | 12.84% | 2.16% | 1.24% |
| P/E Ratio | – | 12.664 | 1.38 | 101.9 |
| ROA | -1.81% | 7.97% | 0.319% | 0.49% |
| ROIC | 2.24% | 12.53% | 0.59% | 3.94% |
| Debt-to-Equity | 3.61 | 0.29 | 0.0332 | 1.1 |
| Net Income Margin | -2% | 6.59% | 0.278% | 0.57 |
| EBIT Margin | 3.58% | 8% | 0.3196% | 8.2% |
| EPS | -0.49 | 3.92 | 0.0864 | – |
| Revenue Growth | 0.57% | 1.77% | 0.0312% | -0.28% |
| Dividend Yield | 2.32% | 2.43% | 0.1016% |
3.61% |
(Note: Nike is the parent company of converse, each figure represents 4% of Nike’s total figures since converse contributes approximately 4% to Nike’s revenues according to its 2025 annual report)
VFC shows a negative ROE of -12.06% and ROA of -1.81% for obvious reasons already discussed reflecting its challenges and efforts to become profitable again. The loss is mainly attributed to higher operating costs and other restructuring costs.
On the other hand, when we look at the North Face’s main competitor, Columbia it’s well managed and in a better position with a positive ROE of 12.84% and ROIC of 12.54% suggesting efficient use of equity and capital.
However, other brands such as Converse and Dr. Martens which are direct competitors to Vans and Timberland both generated lower profits. Note converse’s small ROE reflects its 4% contribution to Nike’s overall results. Dr. Martens is more profitable and has way better margins than VFC as reflected in its EBIT margins.
VFC’s 2025 ROIC of 2.24% is below Columbia’s 12.54% indicating inefficient use of capital leading lower returns on invested capital. On the other hand, Dr. Martin has a higher ROIC of close to 4% implying better investment returns relative to capital employed.
VFC’s debt-to-equity ratio of 3.61 is the highest suggesting high leverage and reliance on debt financing. Columbia is the least leveraged company indicating financial stability. Converse on the other hand has negligible direct debt since Nike’s corporate structure absorbs most liabilities. However, Dr. Marten is moderately leveraged at 1.1.
VFC’s EBIT margin of 3.58% is significantly lower than its competitors indicating current struggle with brand restructuring. VFC has slow growth but maintains a decent dividend of 2.32% focusing on shareholder return despite weak profits. Columbia shows a higher growth yet a similar dividend yield, whereas Dr. Martens has a higher dividend yield of 3.61% which is relatively attractive as compared to others.
Therefore, VFC is historically known for its strong brand portfolio and solid margins. However, it is evident from these metrics that the company is currently going through a transitional phase marked by a negative ROE and limited revenue growth in the short term.
FCF Based Valuation
Based on VFC’s FCF growth for the last 5 years, the company appears to be trading well above its short-term fair value at its current market price of $14.58 per share. Despite lowering of interest rates by the Fed in its recent FOMC, we still applied a conservative discount rate of 10% considering the challenges and risks faced by VFC in the short term. Its fair value based on the last 5 years free cash flows suggest a price of 12.88 per share.
Therefore, apparently the current market has already priced in the near-term recovery prospects and restructuring benefits of VFC. Therefore, we assign a “Hold” rating for VFC at its current price in the medium to long term.
EBIT based Sum-of-the-parts (SOTP) Valuation of VFC
Since VFC has many well-known brands under its umbrella which we think must be evaluated independently on their own based on their EBIT and FCF contribution to arrive at a fair value. Therefore, the SOTP valuation using an industry average EBIT multiple of 8, 9-12x for its 3 main brands, The North face, Vans and Timberland we arrive at the following valuation of $8 per share.
| Top Brands | EBIT (Amount in Million) | Multiple | Valuation |
| The North Face (Outdoor) | $131 | 12 | $1,572 |
| Vans (Active) | $57 | 9 | $513 |
| Timberland (Work) | $131 | 8 | $1,048 |
| Total SOTP | $3,133 | ||
| Fair Value SOTP / No of shares outstanding’s diluted | $3,133 / 392.6 = 8/ share |
EBIT based SOTP valuation (Competition)
| Competitors | EBIT | Multiple | SOTP (Amount in $million) | Shares Outstanding (million) | Fair Value SOTP/ Shares outstanding diluted |
| Columbia | $273 | 12 | $3,276 | 54.8 | 60 per share |
| Dr. Martens* | $49.1 | 8 | $392.8 | 974.1 | 0.40 per share |
| Converse** | $240 | 9 | $2,160 | 60 | 36 per share |
*For Dr. Martens the amounts have been converted from British Pound to US$
** Converse contributes 4% of Nike’s total revenues hence 4% of Nike’s EBIT has been taken for this calculation.
It appears that VFC’s competitor group are all trading either at or slightly above their EBIT based SOTP valuation. It is evident that the broader apparel and footwear sector may currently be experiencing valuation premiums due to investor optimism.
FCF based SOTP of VFC
We also applied free cash flow Multiple to VFC’s SOTP and made a comparison to know the difference. Therefore, an industry average FCF multiple of 20x given VFC’s recovery trajectory and strong brand portfolio suggest a SOTP valuation of 17 per share in the short term.
| Top Brands | FCF (Amount in Million) | Multiple | Valuation | |
| The North Face (Outdoor) | $153.04 | 20 | $3,060.8 | |
| Vans (Active) | $97.08 | 20 | $1,941.6 | |
| Timberland (Work) | $88.8 | 20 | $1,776 | |
| Total SOTP | $6,778.2 | |||
| Fair Value = SOTP / No of shares outstanding diluted | $6,778.2 / 392.6 = 17 per share | |||
FCF based SOTP valuation (Competition)
| Competitors | Free Cash Flow (Million) | Multiple | SOTP | Shares Outstanding’s (million) | Fair Value = SOTP/Shares outstanding diluted) |
| Columbia | $257 | 20 | $5,140 | 54.8 | 93.79 per share |
| Dr. Martens* | $229.5 | 20 | $4,590 | 974.1 | 4.71 per share |
| Converse** | $120.36 | 20 | $2,407.2 | 60 | 40.12 per share |
*For Dr. Martens the amounts have been converted from British Pound to US$
** Converse contributes 4% of Nike’s total revenues hence 4% of Nike’s EBIT has been taken for this calculation.
Source: Moods Investment Research
Among VFC’s key competitors, Columbia, Dr. Marten and Converse indicate consistently positive FCF generation reflecting strong brand equity and stable demand. However, based on FCF multiple applied to SOTP valuation, Columbia seems to be significantly undervalued at its current price driven by its strong cash generation reflecting investors’ confidence, growth as well as profitability. Dr. Marten with $229.5 million of FCF indicating a fair value of $4.71 per share. Converse indicates a fair value of $40.12 per share based on its 4% contribution to Nike’s overall FCF.
Therefore, VFC relative to others seems to be trading close to its fair value despite a higher FCF multiple.
Key Risk factors affecting VFC
The higher Tariffs and interest rates are most important external risks considering VFC’s global exposure and presence as a brand. Its global supply chain exposes it heavily to international trade policies between the U.S and Asia where a large portion of its manufacturing base and sourcing partners are located. The tariffs directly increase the cost of goods sold. VFC has partially mitigated the impact of tariffs by diversifying its manufacturing footprint beyond China and negotiating with suppliers in other countries but these measures take time to fully offset the impact, hence a sudden change in policy may not be materialized anytime soon.
Higher tariffs therefore would continue to compress margins, potentially delay product delivery, disturb sourcing efficiently in the short term. VFC has exposure to tariffs because it sources raw material and imports products from independent manufacturers in China as well as other Asian countries such as Vietnam. Although its impact from China and other countries such as Vietnam is limited, VFC manages the risk through diverse sourcing, regional distribution strategies and supply-chain flexibility hence reducing the impact on overall profitability.
In addition, the company has its dependence on consumer spending for its brand’s performance and continues to face execution challenges within its ongoing turnaround plan. As a global apparel and footwear firm, the company operates in a highly cyclical and discretionary sector. Its revenue is closely tied to consumers income level, confidence and fashion trends that varies from country to country. Any slowdown in the economy will affect the sales of the company.
Another major risk lies in the uneven performance of its core brand Vans which is struggling with its sales momentum not showing any signs of picking up in the last few years. If VFC fails to effectively execute its brands revitalization strategy the company could continue to face weak top line growth. While iconic brands Timberland and The North Face remain strong however, overreliance on a few high performing brands creates immense pressure on the company as a whole.
Moreover, the apparel market is a highly competitive and VFC faces constant price pressure from big players like Nike, Columbia Sportswear that adapt faster to consumer trends.
The operational and execution risk is another big risk factor for VFC’s reinvest program involving challenges such as major structural changes and significant cost reductions which could lead to employee dissatisfaction and termination. Any delays or bad execution could possibly affect shareholders confidence affecting the company’s share price pushing it down further reaching an even more depressed level.
Conclusion
VF Corporation is at a turning point, transitioning from restructuring towards growth and stability. Its focus on efficient capital allocation, optimization, deleveraging, operational and brand momentum could position it well for gradual earnings and margin improvement. Although the company’s near-term performance remains constrained by weaker customer demand but after restructuring and significant cost reductions, it is generating positive cash flows which has improved its medium-term outlook.
Although the current market price already reflects most of the turnaround optimism in the company’s share price however, there are potential tailwinds such as lower interest rates and inflation which could drive renewed investor confidence and a higher share price in the medium to long run.
Disclaimer
The information provided by Moods Investment Research is for general informational and educational purposes only. It is not intended as, and does not constitute, financial, investment, tax, legal, or other advice. The content is not a solicitation or recommendation to buy, sell, or hold any securities or investment strategies.
All opinions expressed are based on current analysis and are subject to change without notice. While we strive for accuracy, Moods Investment Research
makes no representation or warranty as to the completeness, accuracy, or reliability of any information provided. Investing involves risk, including the possible loss of principal. Past performance is not indicative of future results. You should conduct your own research and consult with a qualified financial advisor before making any investment decisions.
Moods Investment Research and its founders, directors, or affiliates are not liable for any losses or damages arising from any reliance on the information provided.
The views expressed in this article are those of the author(s) and do not constitute investment advice. The author holds a position in VF Corporation. However, the author(s), including any editors or contributors (collectively referred to as “Moods and directors”), may or may not hold positions in other securities mentioned. Any such holdings are subject to change without notice. Some content on this platform is generated using AI tools.